Something strange has happened the past few days: long-term interest rates are rising as stock prices are falling. This is opposite the classic “risk on”/ “risk off” formula which has dominated almost all of the current bull market. Money flowing out of risk investments, like stocks, tends to flow to “safe” investments like bonds. But this is not happening. Bonds are declining despite stock market weakness. Could this be a sign of an impending top in both?
Small signals like this can prove very powerful. Markets that don’t do what they are “supposed to” often signal fundamental changes which can have a big impact down the road. The big rally in grains began with such an event, which we wrote about this past August. Soybeans responded to a decidedly bearish USDA crop report with a big rally. This began an incredible bull run that spiked prices from a low of $8.67 per bushel to over $14.00 in six months.
While it may seem strange to mention grains in a blog about stocks and bonds, we believe ALL markets are human creations and tend to act in similar ways. The psychology is the same. Stocks and bonds are compelling now because they are about as expensive today as soybeans were cheap back in August.
Shiller PE Ratio
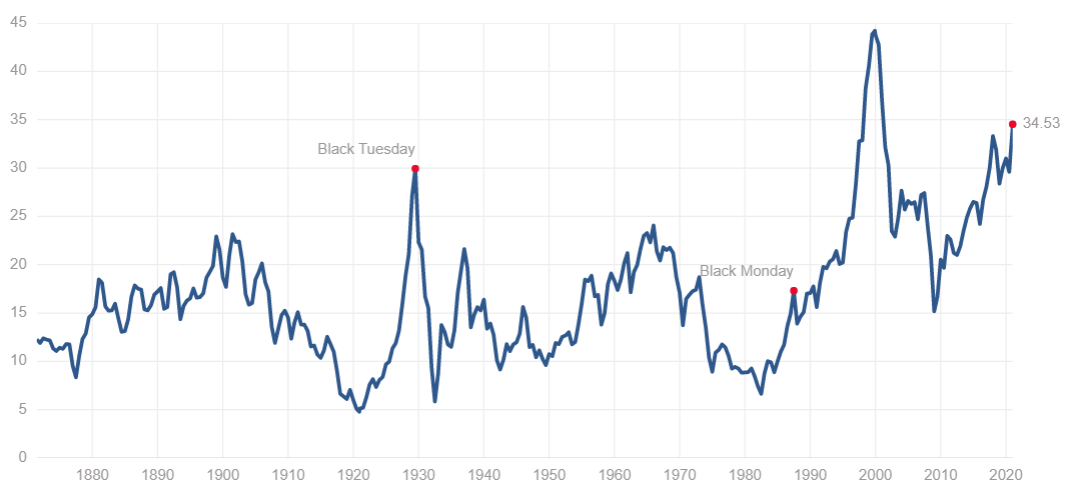
Source: Multpl.com
The chart above shows the Shiller PE ratio for the S&P 500. At 34.53, it is higher than at any other time since the infamous, turn-of-the-century “dot.com” crash. And while stocks could certainly become more expensive, each new high makes the stock market even more vulnerable – especially considering the slow-moving downside reversal currently underway in bonds.
It’s Never “Different This Time”
The claim “It’s different this time” always seems to accompany market highs. Today’s stock market bulls will undoubtedly point to the Fed’s promise to backstop nearly every asset class, the additional stimulus money flowing in the economy from Democratic control of government and continued TINA (there is no alternative) buying by both institutions, and the Robinhood crew as reasons why.
And they will be correct, right up until the moment they aren’t. By the time dyed-in-the-wool stock market bulls realize the underlying reasons for their bullish thinking have changed, it will be too late. These changes will most likely be discounted by free-falling prices. Fear is much more powerful than greed. This makes the ride down in any market far faster than the one up. Stocks have been taking the stairs up. History says they will take the elevator down. It is never “different this time.” The only question is – when is someone going to push the “down” button?
Stocks have shown a remarkable ability to shrug off nearly every bearish development. Nearly 400,000 dead from coronavirus? No problem. A Capitol coup? Don’t worry, they’ll figure it out. The stock market has been ignoring potentially-bearish political events for months because it is focused on one thing: The Fed. The stock market will continue to rally as long as it believes Jerome Powell and Company has its back. The recent uptick in bond yields could be a sign that this is changing.
Bonds Are Still Expensive, But Getting Less So
We’ve been pretty convinced that any lasting decline in the stock market would need to be preceded by weakness in the bond market. This is why we’ve held off on bearish recommendations in the stock indexes until we saw movement in the bonds. We outlined a contrarian, bearish case for 10-year T-notes in our December 10 blog post based on the negative real rates of return they were generating. Both 10-year notes and 30-year Treasuries have been declining (and their yield rising) in response to inflation. The Fed has not intervened. The longer they hold off, the more power market forces will have.
(Trading Note: RMB trading customers who own more than one of the March 2021 137-00 T-note puts we suggested purchasing for $594 or less in our December 10, 2020 post may want to consider placing an order exiting half of your position at twice your original entry level, taking your initial risk “off the table” in the process. These puts settled for $953 yesterday. Hold the balance for a move to our 135-00 downside objective.)
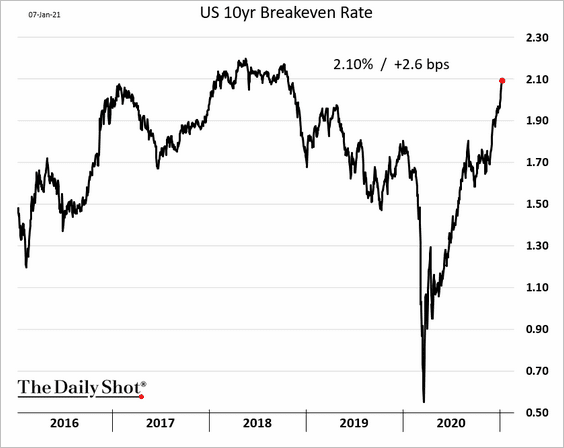
As the charts below illustrate, negative real rates of return are almost as low now as they were in early December, despite a corresponding decline in T-note prices and a big increase in yield. Nominal Ten-year yields were well below 1% when we posted our December blog. Now they are 1.15%. Why hasn’t real yield budged? Rising inflation. Perhaps this is why the Fed is not in a big hurry to step into the market. Yes, the Fed wants inflation, but may be satisfied that the trillions of new, post-election Fiscal Policy stimulus dollars flowing into the economy will be sufficient to achieve it.
Ten Year Note Real (Inflation Adjusted) Yield
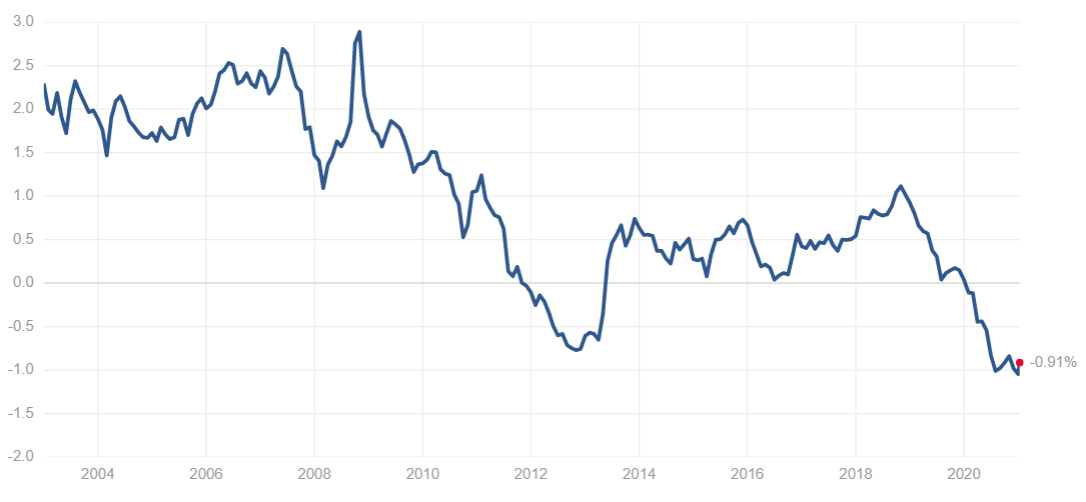
Source: Multpl.com
Ten Year Note Nominal (Non-Inflation Adjusted) Yield
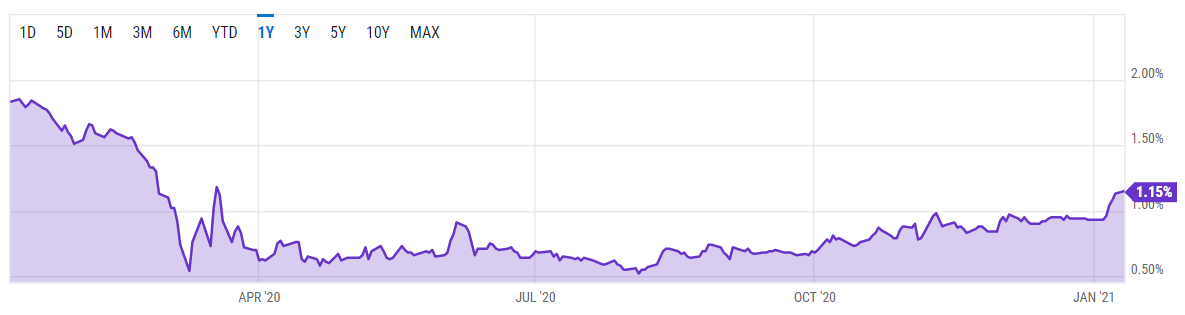
Source: Y Charts
If this is the case, it represents the first “crack” in the Fed’s resolve since March 2020. Chairman Jerome Powell does not want the Fed to exert total control over the bond market or the fate of the economy. He has been begging the Trump Administration for additional Fiscal Stimulus since the CARES act. Powell got what he was looking for in December, and will likely get a lot more in the coming months. This gives the Fed leeway to back off Treasuries and let the market set rates.
Less-than-zero real yields in the Ten-year are rare. They don’t last very long when they occur. Note how fast they rebounded during 2013 in the “real yield” chart above. Left alone, market forces would likely bring the real inflation rate back to zero relatively quickly. The chart below shows what would happen to 10-year yields should real rates return to zero at current inflation levels. Higher inflation would require T-notes to sport even higher nominal yields (and sharply lower prices) just to get real yields back to zero.
The Fate of Stocks Is Tied to Bonds
If the incredible bull market is, as we believe, more a product of Federal Reserve tinkering than typical supply, demand and earning fundamentals, then the fate of stocks is intimately linked to bonds. Weakness in the latter should engender weakness in the former as rising bond yields compete for the investor dollars currently driven into stocks. Bonds are the only game in town for those who want to do better than inflation. The faster bond yields rise, the more bearish they could become for stocks.
We looked at soaring PE ratios at the beginning of this blog, but here are a few more indicators of a bulging bubble in stocks: 1) margin debt is at record highs; 2) 10 million new brokerage accounts were opened in 2020; 3) individual investors accounted for 25% or more of stock trading volume on peak trading days; 4) the trading app, Robinhood, has introduced millions of inexperienced Millennial and Gen Z stock traders into the market in 2020; 5) the personal saving rate in 2020 was $1.56 trillion higher than in 2019 – a 173% increase – due to reduced spending caused by the coronavirus.
What happens when things return to “normal” and quarantined investors get out of the house and start consuming again? How will the millions of rookie traders react to their first big margin call? What could possibly go wrong?
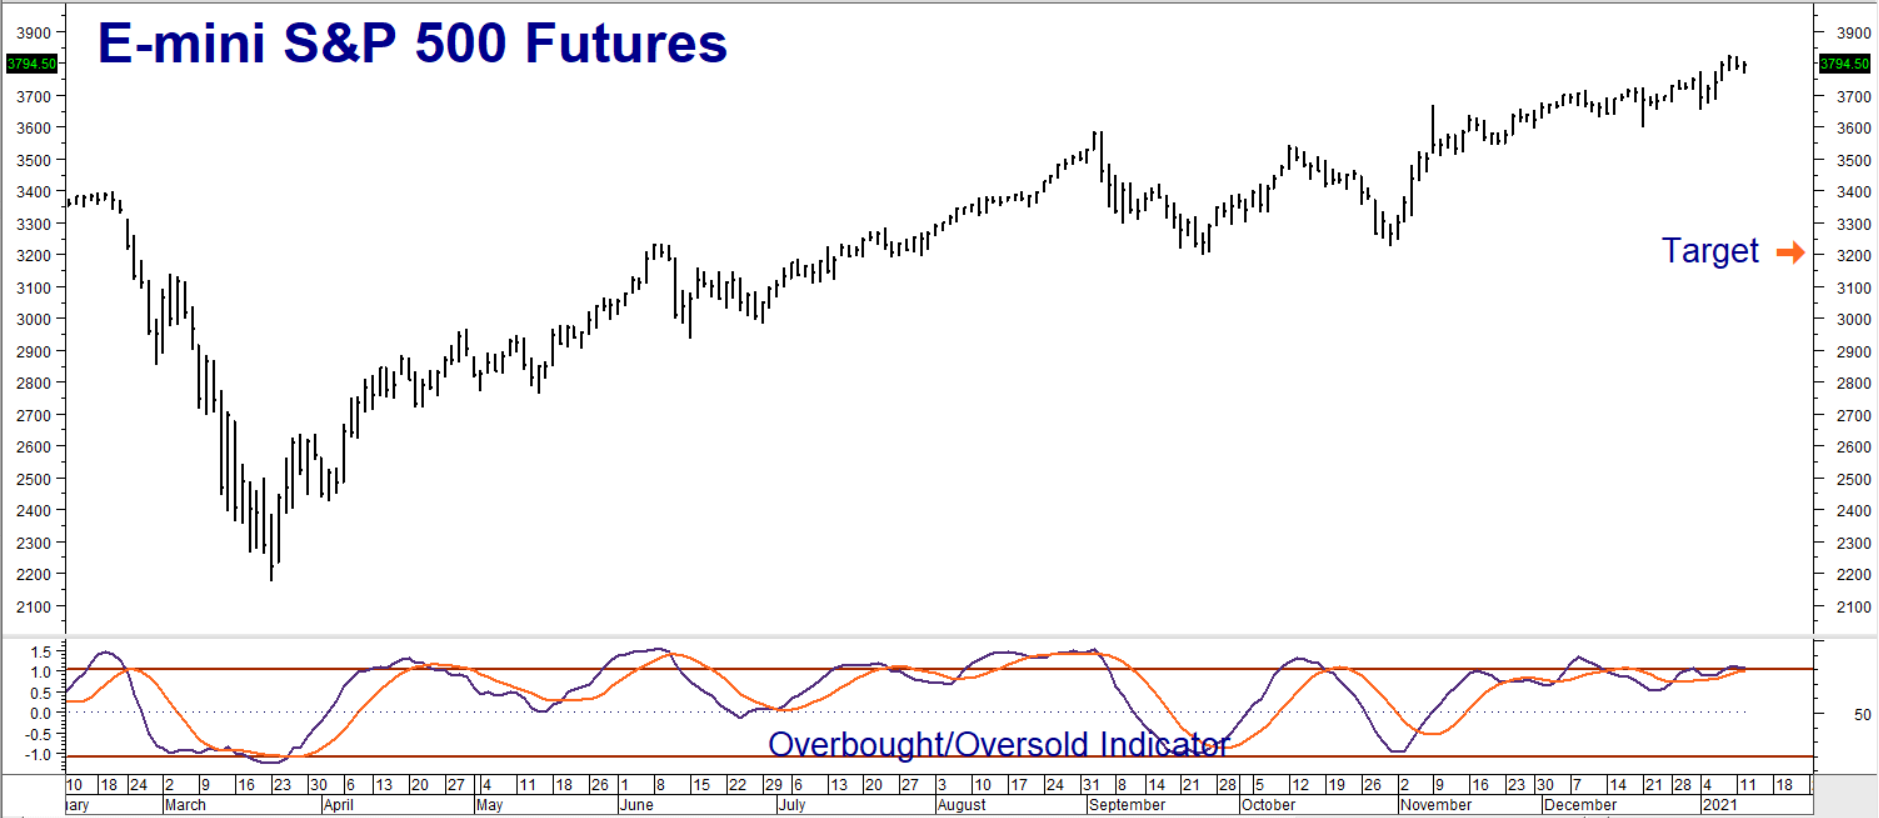
The bigger the current stock market bubble gets, the more vulnerable it will be. Valuations may matter little in the feeding frenzy of a runaway bull market, but they become everything once the fever breaks. We’ve pretty much stayed away from the short side of stocks in 2020. But 2021 is a new year. An overbought S&P and recent bearish action in the bond market is telling us it may be time to get our feet wet.
Data Source: Reuters/Datastream
RMB Group trading customers may want to consider buying March 2021 3400 E-Mini S&P 500 puts while simultaneously selling an equal number of March 2021 3200 E-Mini S&P 500 puts for a net cost of $900 or less. Look for the March E-Mini S&P 500 futures contract to decline to 3200 prior to option expiration on March 19, 2020. Your maximum risk is the net price paid for this “bull call spread” plus transaction costs. This spread has the potential to be worth as much as $10,000.
Stock index puts of all types are costly, pricing in implied volatilities as high as 40%. Selling the 3200 put against our long 3400 put reduces both the cost and the risk of this position. In exchange, we give up the opportunity to make more should the index drop below 3200. Prices can and will change. Contact your RMB brokerage professional for the latest pricing and/or changes to the above recommendation.
Trade Update: Corn hit our upside objective of $5.20 per bushel in yesterday’s session. RMB trading customers who followed our suggestion to buy March $4.40 calls for $700 in mid-November should consider exiting all their positions immediately. These calls settled at yesterday at $4,287.50. Prices can and will change so check with your RMB Group professional for the latest.
Please be advised that you need a futures account to trade the markets in this post. The RMB Group has been helping our clientele trade futures and options since 1991. RMB Group brokers are familiar with the option strategies described in this report. Call us toll-free at 800-345-7026 or 312-373-4970 (direct) for more information and/or to open a trading account. Or visit our website at www.rmbgroup.com. Want to know more about trading futures and options? Download our FREE Report, the RMB Group “Short Course in Futures and Options.”
* * * * * * * *
The RMB Group
222 South Riverside Plaza, Suite 1200, Chicago, IL 60606
This material has been prepared by a sales or trading employee or agent of R.J. O’Brien & Associates (“RJO”)/RMB Group and is, or is in the nature of, a solicitation. This material is not a research report prepared by a Research Department. By accepting this communication, you agree that you are an experienced user of the futures markets, capable of making independent trading decisions, and agree that you are not, and will not, rely solely on this communication in making trading decisions.
DISTRIBUTION IN SOME JURISDICTIONS MAY BE PROHIBITED OR RESTRICTED BY LAW. PERSONS IN POSSESSION OF THIS COMMUNICATION INDIRECTLY SHOULD INFORM THEMSELVES ABOUT AND OBSERVE ANY SUCH PROHIBITION OR RESTRICTIONS. TO THE EXTENT THAT YOU HAVE RECEIVED THIS COMMUNICATION INDIRECTLY AND SOLICITATIONS ARE PROHIBITED IN YOUR JURISDICTION WITHOUT REGISTRATION, THE MARKET COMMENTARY IN THIS COMMUNICATION SHOULD NOT BE CONSIDERED A SOLICITATION.
The risk of loss in trading futures and/or options is substantial and each investor and/or trader must consider whether this is a suitable investment. Past performance, whether actual or indicated by simulated historical tests of strategies, is not indicative of future results. Trading advice is based on information taken from trades and statistical services and other sources that RJO/RMB believes are reliable. We do not guarantee that such information is accurate or complete and it should not be relied upon as such. Trading advice reflects our good faith judgment at a specific time and is subject to change without notice. There is no guarantee that the advice we give will result in profitable trades.