Money is a commodity and like any commodity, it responds to supply and demand. Interest rates measure the price of money. The short-term cost to borrow dollars from the US Federal Reserve is now effectively zero. Unlike the European Central Bank (ECB), the Fed has shown very little interest in negative interest rates. This means dollars are about as dirt cheap as they can get. The market is oversupplied.
Too much of anything can prove disruptive as anyone who has experienced a “hangover” will attest. The longer dirt-cheap money gets poured into the punch bowl, the more painful the morning after. Zero interest rates deflate the purchasing power of money while they inflate bubbles (especially in stocks and housing). Zero rates make the stock market the only game in town and encourage wanton risk-taking. This leads to market dislocations and potentially disruptive malinvestment.
We don’t need to look far to find examples. Ten-Year Treasury notes currently yield less than 1%. Factor in inflation, and their real yield is negative 0.94%. Investors, many of them sophisticated, are willing to lose money in exchange for liquidity and “safety.” This shouldn’t happen but, as the chart below illustrates, has happened twice in this decade.
Ten Year Note Real (Inflation Adjusted) Yields
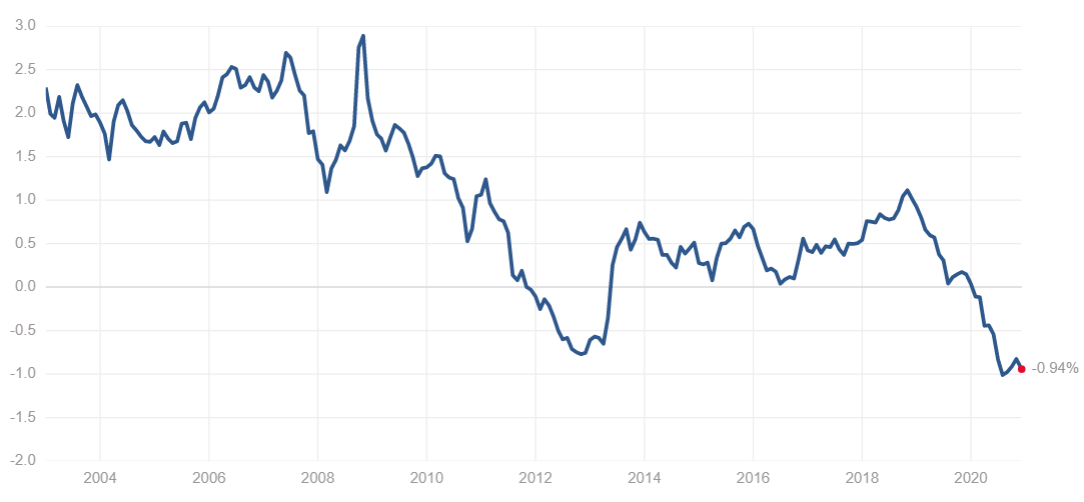
Source: Multpl.com
Why now? Because investors are confident the Fed has their backs and will step in and increase bond and note purchases, pushing prices up and yields lower. This confidence will disappear once investors can no longer borrow short-term money at a cost of near zero. As the chart above illustrates, negative real yields didn’t last long after the last recession. We suspect they won’t this time either.
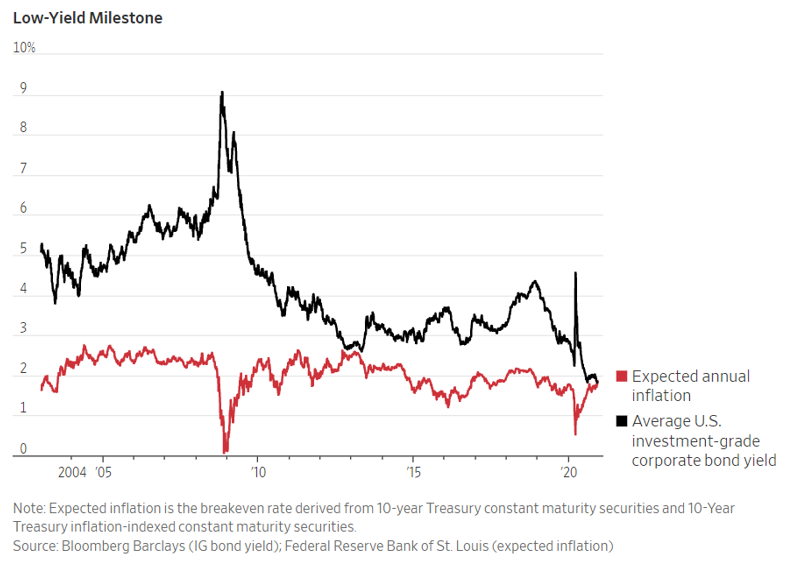
Corporate Debt Not Paying Investors for Risks
The Fed’s promise to backstop corporate debt is causing similar dislocations in the corporate bond market. Corporate bonds are not backed by the Federal Government, but by the corporation issuing them. This makes them riskier than government debt. Corporate debt now yields the same as the inflation rate, making its real yield “zero.” This means investors are willing to lend to corporations and assume much larger risks, for a real return of zero, confident the Fed “has their backs.”
Inflation & Illiquidity Are Threats to Bond Bull
Both of these strategies are only viable if inflation stays low. Rising inflation will eventually depress real yields enough that buying and/or holding bonds stops making financial sense. Improving GDP numbers will likely be viewed as a signal of increasing inflation and achieve the same end prior to inflation actually showing up. In either case, investors will eventually start unloading corporate and Treasury paper, causing prices to fall and yields to rise. This process could be accelerated by the coronavirus vaccine and additional government (Fiscal) stimulus, the latter of which is going to happen in some form prior to or after the inauguration.
The president of the Federal Reserve Bank of Chicago, Charles Evans, recently stated his preference for targeted government stimulus over more asset buying. The approval of a vaccine could cause pent-up post-COVID demand to light a fire under parts of the economy that have been stymied by the virus at the same time the Federal Reserve is pulling back on asset purchases.
Fewer individual investors buy actual bonds, choosing to purchase bond ETFs and bond mutual funds instead. This makes sense from a convenience standpoint, since buying and selling individual bonds can be a lot more complex than individual stocks. Many bond ETFs are liquid, but many of the bonds they hold aren’t. Forced liquidation of the bonds backing these products could exaggerate downside volatility as bond investors rush toward the exits.
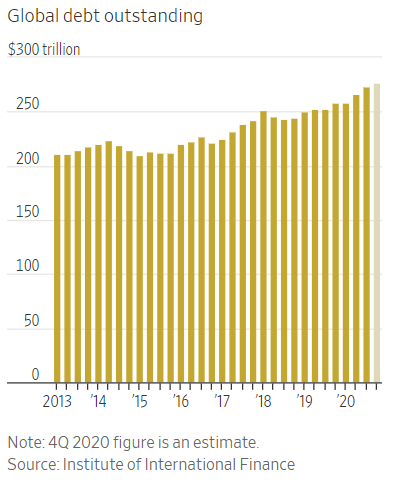
Global Debt Levels Exploding
Historically-low interest rates have incentivized businesses and governments to issue a record $9.7 trillion of debt this year. $5.1 trillion of this is corporate debt. Cumulative global debt could top $277 trillion by the end of 2020 according to the Institute of International Finance. This amounts to 365% of global GDP. The “smart money” is selling.
US businesses have issued more than $1.4 trillion of new debt this year, a 54% increase over 2019. Junk bond issuance is up over 70%. Where is this money going? Some of it is being used to expand businesses that have benefitted from COVID. Part of it is sitting on the sidelines, waiting for good news on the virus. Some is being used to buy back shares, helping to inflate the stock market.
Treasury Market Close to a Tipping Point
With so much debt already issued and so much dirt-cheap money already collected, one wonders who will be around to purchase more debt once the bond bubble bursts. How high will yields need to climb – and how low will prices need to go – to clear the market? We will soon find out.
The classic “60/40” stock-to-bonds mix referenced in financial circles is supposed to cushion downward surprises in stocks with the relative stability of bonds. However, artificially-low interest rates and dirt-cheap money resulting from these low rates have produced bond prices that are now expensive enough to pose a threat to overall portfolio health. It rivals the stock market collapse everyone seems to be waiting for. What if the real danger lies not in “risk assets” like stocks, but in the outwardly sedate and mundane bond market?
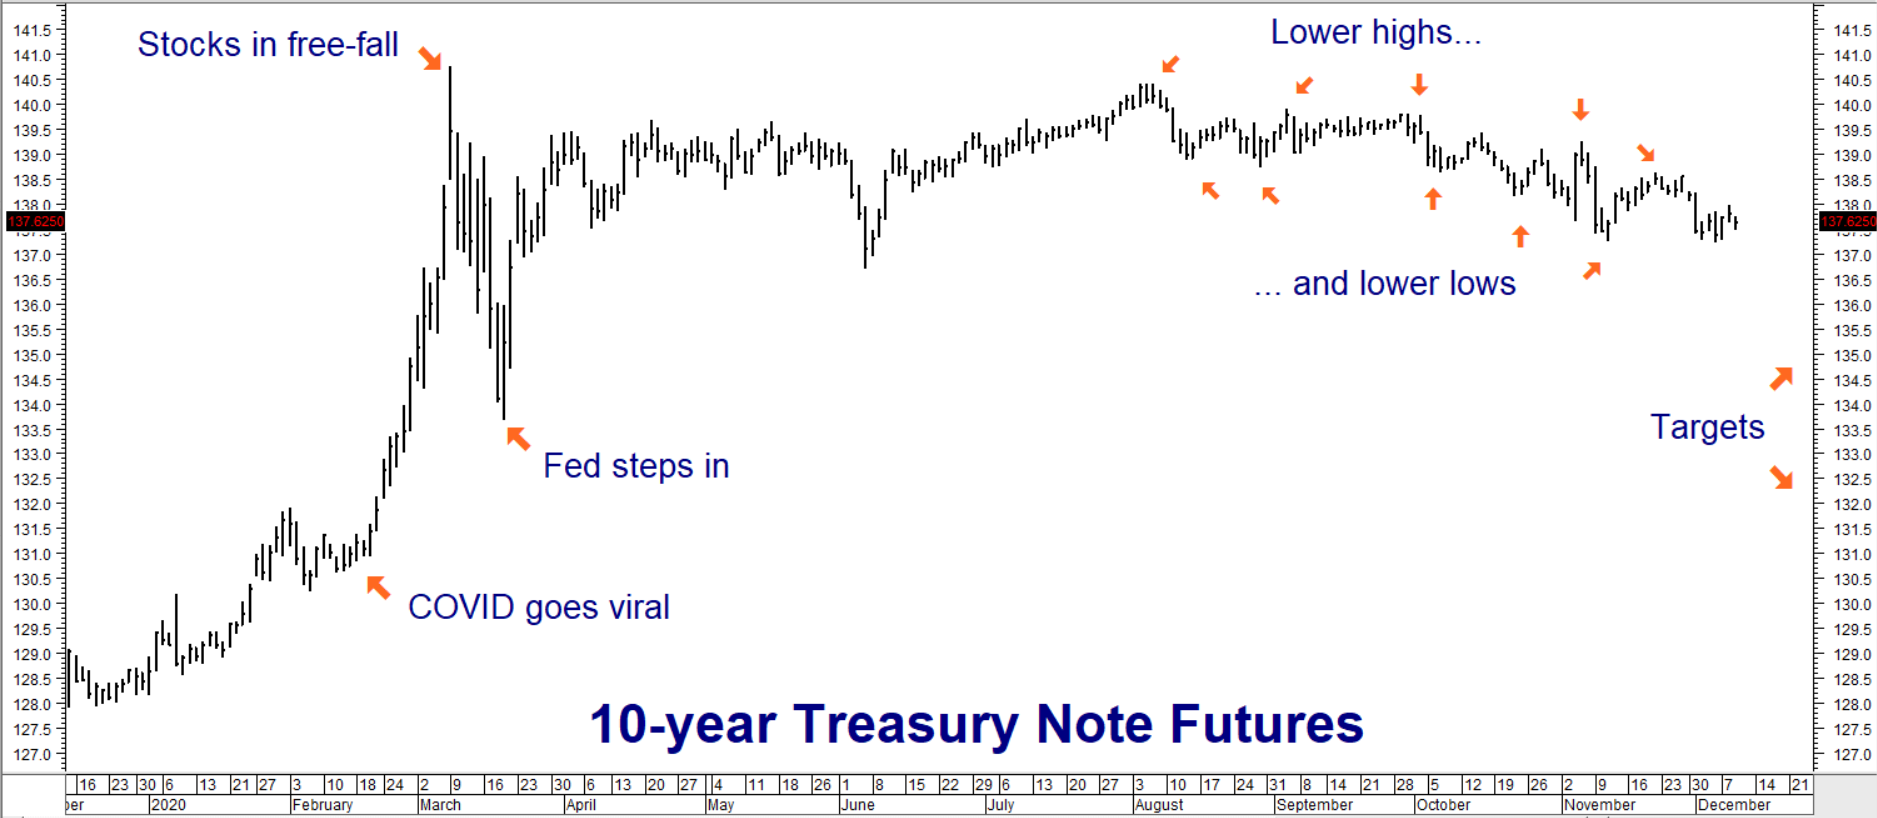
Bond prices have soared over the past two years as yields have plummeted. We believe these gains are being taken for granted. Most investment portfolios are chockful of bonds, making them vulnerable to falling prices. Investors expect downward corrections in their equity allocations, but not their bonds. The last downward correction occurred during the March stock market meltdown (see chart below). Ten-year futures prices fell by 5% in just 8 days. It got so bad the Fed decided to stop the slide by promising to support the market.
Data Source: Reuters/Datastream
Ten-Year Treasury Futures Starting to Sniff Out Higher Rates
A series of lower highs and lower lows in the March Ten-Year T-note futures contract could be subtle signals of an impending (and potentially dangerous) change in trend. At just over 3%, implied volatility T-note put options are reasonably priced, offering us a low-cost way to make a contrarian bet on lower prices and correspondingly higher yields in Ten-Year T-notes. We can also use these options to create a hedge against potentially adverse interest rate moves in our overall investment portfolio. (Note: your RMB Group broker can show you how to do this.)
RMB trading customers may want to consider buying March 137-00 T-note puts for $594 or less, looking for the March futures contract to hit our initial downside objective of 135-00 prior to option expiration on February 19, 2021. A decline to this level would set the stage for a subsequent sell-off to our second downside objective at 132.50.
Your maximum risk is the amount you pay for your put options plus any transaction costs. Your 137-00 T-note puts will be worth at least $2,000 should the market hit our 135-00 downside objective, and at least $4,500 should March T-note futures hit our 132.50 objective prior to option expiration.
Please be advised that you need a futures account to trade the markets in this post. The RMB Group has been helping our clientele trade futures and options since 1991. RMB Group brokers are familiar with the option strategies described in this report. Call us toll-free at 800-345-7026 or 312-373-4970 (direct) for more information and/or to open a trading account. Or visit our website at www.rmbgroup.com. Want to know more about trading futures and options? Download our FREE Report, the RMB Group “Short Course in Futures and Options.”
* * * * * * * *
The RMB Group
222 South Riverside Plaza, Suite 1200, Chicago, IL 60606
This material has been prepared by a sales or trading employee or agent of R.J. O’Brien & Associates (“RJO”)/RMB Group and is, or is in the nature of, a solicitation. This material is not a research report prepared by a Research Department. By accepting this communication, you agree that you are an experienced user of the futures markets, capable of making independent trading decisions, and agree that you are not, and will not, rely solely on this communication in making trading decisions.
DISTRIBUTION IN SOME JURISDICTIONS MAY BE PROHIBITED OR RESTRICTED BY LAW. PERSONS IN POSSESSION OF THIS COMMUNICATION INDIRECTLY SHOULD INFORM THEMSELVES ABOUT AND OBSERVE ANY SUCH PROHIBITION OR RESTRICTIONS. TO THE EXTENT THAT YOU HAVE RECEIVED THIS COMMUNICATION INDIRECTLY AND SOLICITATIONS ARE PROHIBITED IN YOUR JURISDICTION WITHOUT REGISTRATION, THE MARKET COMMENTARY IN THIS COMMUNICATION SHOULD NOT BE CONSIDERED A SOLICITATION.
The risk of loss in trading futures and/or options is substantial and each investor and/or trader must consider whether this is a suitable investment. Past performance, whether actual or indicated by simulated historical tests of strategies, is not indicative of future results. Trading advice is based on information taken from trades and statistical services and other sources that RJO/RMB believes are reliable. We do not guarantee that such information is accurate or complete and it should not be relied upon as such. Trading advice reflects our good faith judgment at a specific time and is subject to change without notice. There is no guarantee that the advice we give will result in profitable trades.