Inflation seems to be everywhere. Home prices are soaring. Key commodities like corn, soybeans, and wheat are approaching contract highs. Lumber is setting new records almost by the day. The inability to source key computer chips has led to factory shutdowns, a shortage of new vehicles, and higher prices on both new and used cars. Gas prices are topping $4 per gallon in some places. The Fed says inflation is expected and transitory – but we have our doubts.
The chart below shows annualized inflation going back to 2011. The current 2.6% increase is the second-highest rate since 2011 (which occurred 2 years after the housing crash of 2008). What was responsible for the increase in 2011? Many would say it was the Federal Reserve’s policy which cut interest rates to virtually zero and started a massive campaign of Treasury bond-buying known as Quantitative Easing or “QE.”
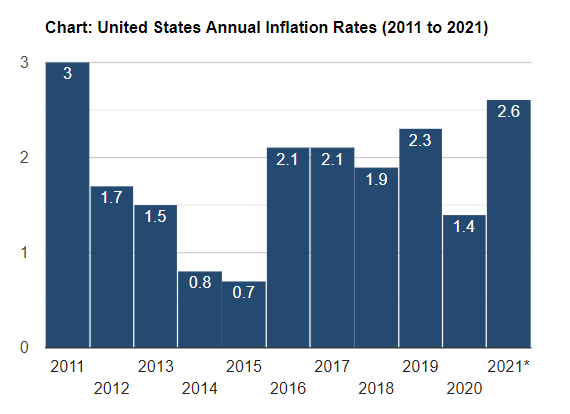
Source: US Inflation Calculator
Jerome Powell and the Fed have been using the same playbook, buying up not only government securities but bonds of all types: municipal, corporate and US government. They are also committed to keeping short-term interest rates at zero, despite an American economy that is expected to grow its GDP by over 6% this year.
Fed action usually comes with a lag, as money released into the banking system in the form of QE takes time to work its way into the real economy. Inflationary policies put in place in late 2008 and the first half of 2009 didn’t begin showing up in the numbers until 2011. Not surprisingly, both gold and silver made new all-time highs in 2011. As we illustrated in our January 2021 blog post among others, many other commodities soon followed.
Inflationary Knock-On Effects Occurring Much Faster
It’s not taking as long for the effects of today’s uber-easy Fed policy to work its way into the economy. The $800 billion TARP program of the 2008/2009 crisis is a fraction of the trillions in Federal (Fiscal Policy) spending already dedicated to Covid relief. Unlike the 2008/2009 response which largely “trickled down” through banks and corporations, the Covid response has put a lot of cash directly into people’s pockets. We believe this has helped eliminate most of the lag.
It took gold 2 ½ years to fully discount the inflationary effects of the Fed’s response to the housing crisis by making new contract highs in 2011. As the chart below illustrates, it took only six months for gold to make new highs following the March 2020 Covid collapse. Gold is rapidly regaining strength in response to the quickening recovery as we write this.
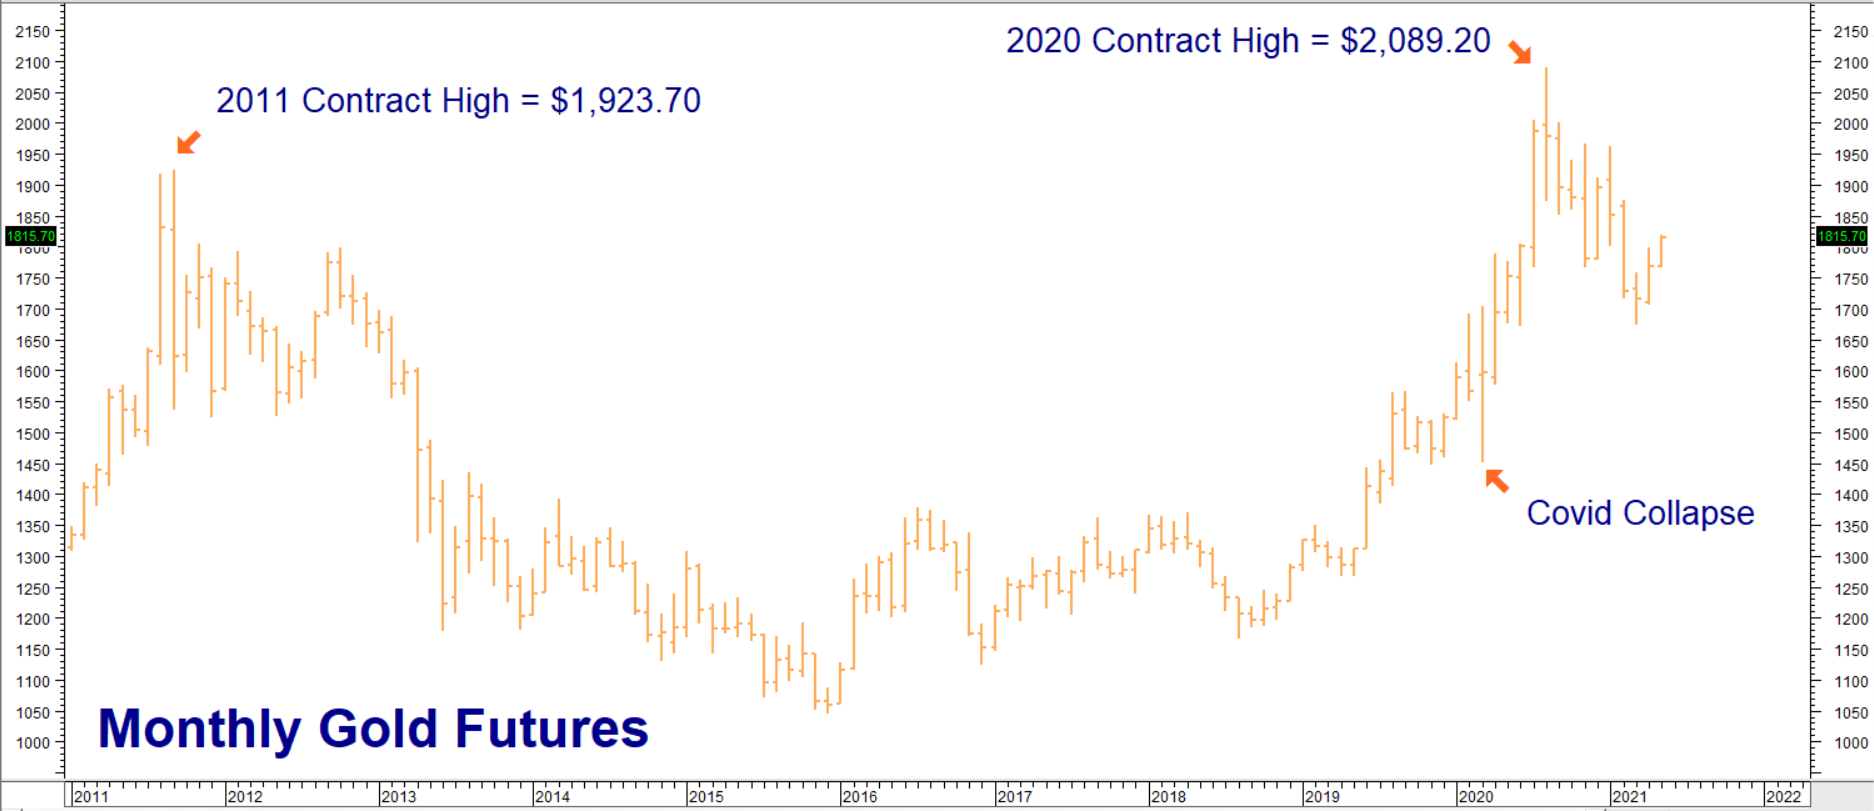
Data Source: Reuters/Datastream
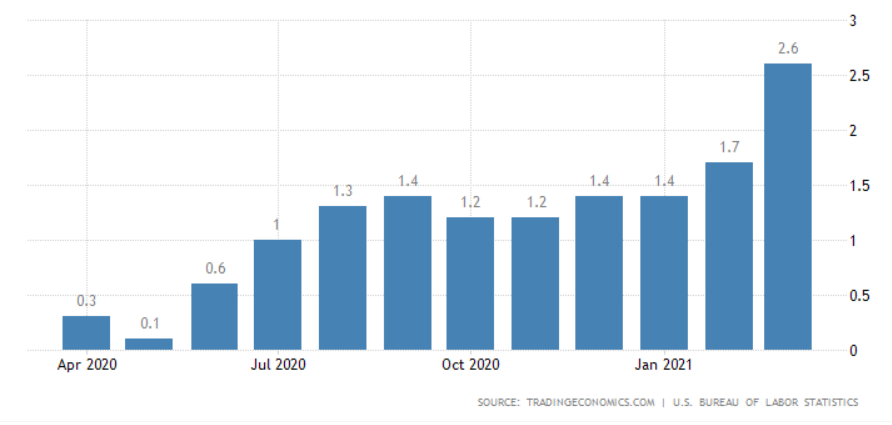
Annualized inflation has been rising steadily since March 2020. It shifted into high gear following the latest $2 trillion Covid relief package passed this spring. (See chart below.) And while most of the government’s stimulus checks have been cashed, trillions more in new infrastructure spending awaits. We are becoming more convinced that inflation is going to be with us longer, and will be stronger and more disruptive than the Fed has calculated.
The Pace of the Current Recovery Is Unprecedented
Former Fed Chair and current Treasury Secretary, Janet Yellen, stated the obvious earlier this week when she said rates “may need to rise.” She walked that statement back soon after, but was joined in cautionary language on Thursday by Robert Kaplan, President and CEO of the Dallas Federal Reserve Bank and Fed spokesperson. He indicated the Fed should consider tapering its bond purchases “sooner rather than later.”
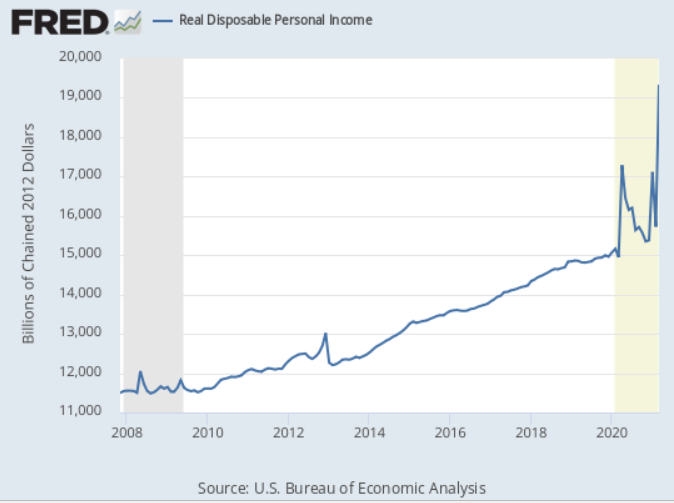
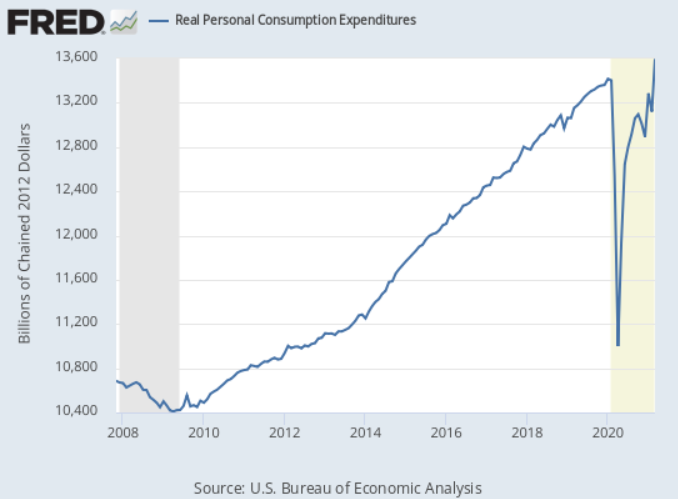
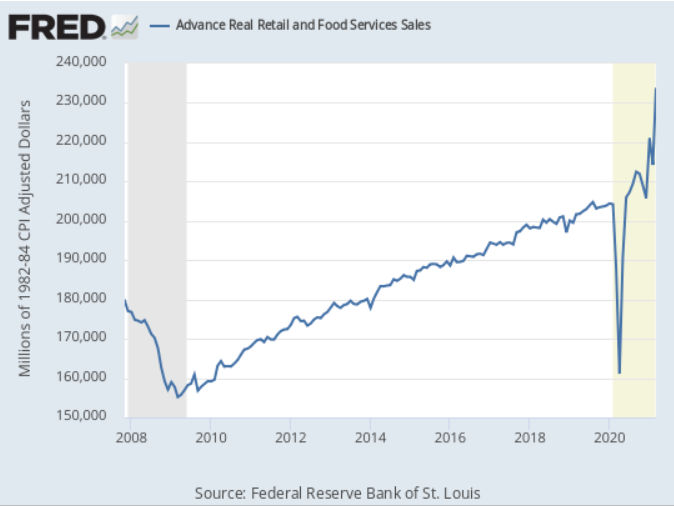
The data is getting too hot to ignore. Real disposable income is skyrocketing. Retail and food sales are on fire. Demand has led to a shortage of chicken wings and higher prices. Plywood prices have more than doubled since March 2020 as has the cost of oriented strand board (OSB). Both are critical in home construction. A shortage of windows is holding up housing projects all over the country. Appliances are expensive and hard to come by.
Many Americans are flush with cash and eager to spend it, but finding it difficult due to shortages. Restaurants are champing at the bit to fully re-open, but can’t find staff at wages they can afford. It appears we are already living in an economy best described by the classic definition of inflation: “Too much money chasing too few goods.”
This series of charts (below) highlights just some of the potentially inflationary tendencies at work right now.
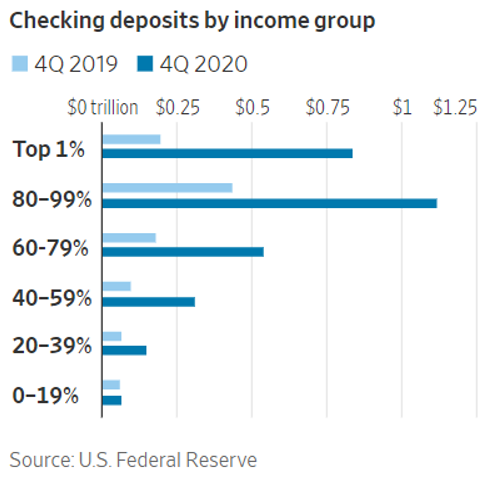
Consumer confidence is close to pre-pandemic levels and checking accounts are flush with cash, so we don’t expect demand to let up any time soon. Will the Fed act and tighten sooner than the markets believe? It is certainly possible. Fed Chairman Powell has already indicated that any tightening will begin with a “taper” of its bond purchases. This could be very bearish for US Treasury notes and bonds.
We want some cheap exposure to higher long-term rates before any announcement is made. Options are one way to get it.
Consider Fixed Risk Short Position in 10-Yr T-Notes
Given the real potential of a runaway economic recovery and potential Fed action to slow it, RMB Group Trading Customers may want to re-establish a fixed-risk short position in T-notes using T-note futures options. We originally recommended a short position in T-notes in mid-December. We were hoping for more of a corrective bounce before re-stablishing our position, but are concerned we may not get one given the pace of the recovery.
T-note futures have only been able to manage an anemic sideways correction following their early-April collapse to 131-00. They appear to be setting up for a test of their pre-Covid lows. Our target is a decline to 127-00 prior to the expiration of the September 2021 put options on August 27, 2021.
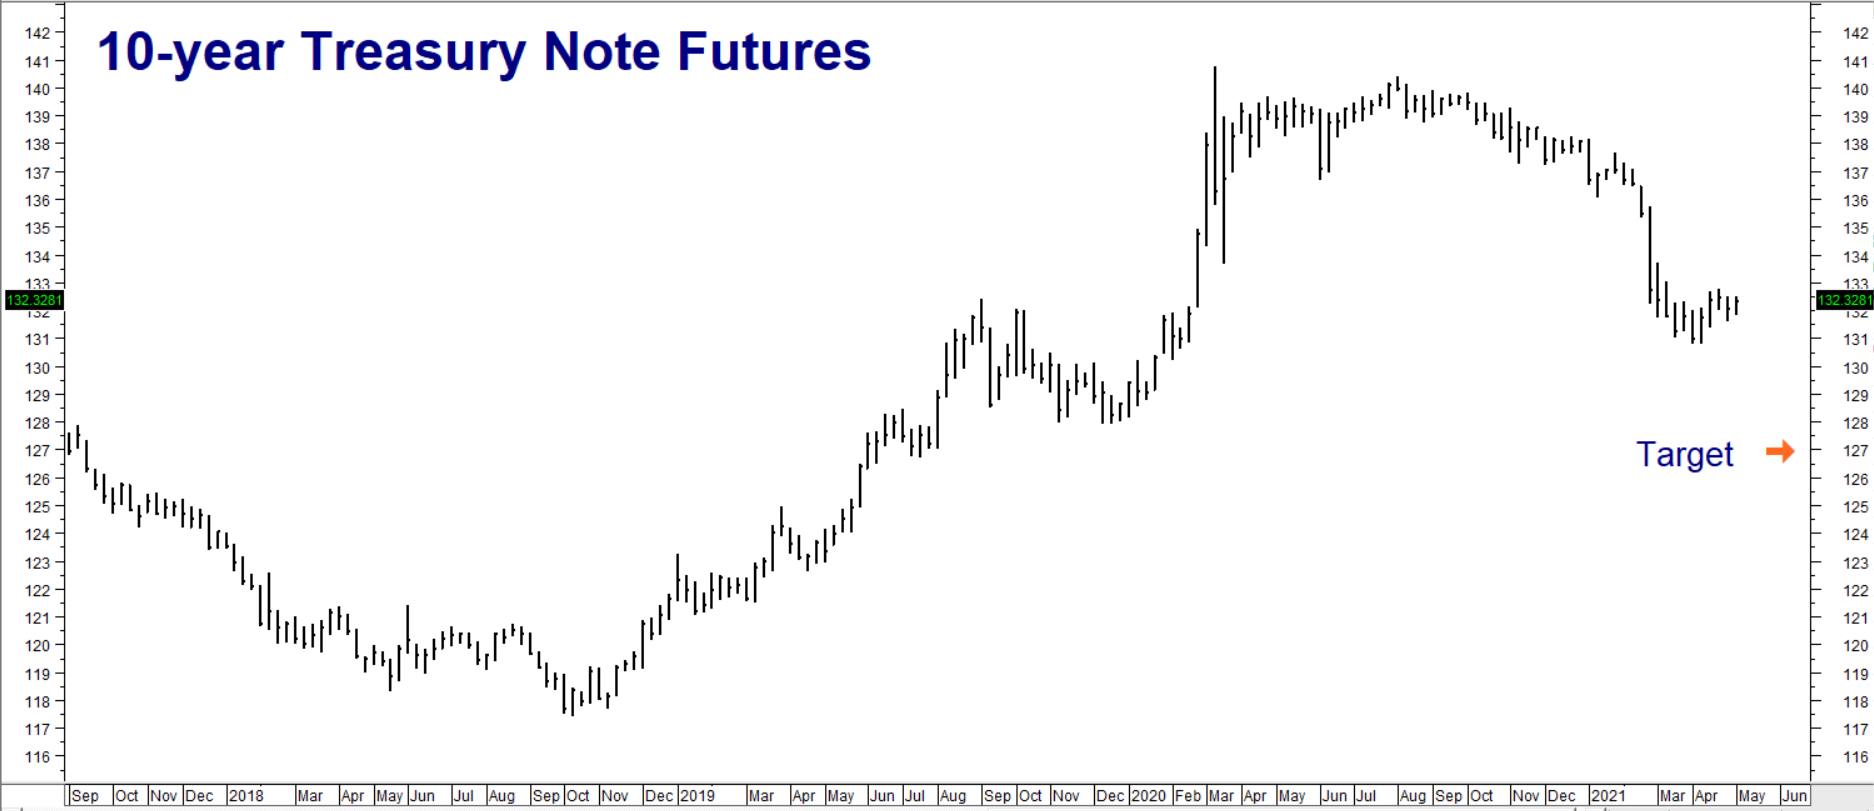
Data Source: Reuters/Datastream
Consider buying September 130-00 T-note puts while simultaneously selling an equal number of September 127-00 T-note puts. This “bear put spread” is currently trading for $500. This strategy has the potential to be worth as much as $3,000 per spread. Your maximum risk is the net price paid this spread(s) plus transaction cost. Prices can and will change, so contact your RMB Group professional for the latest.
Please be advised that you need a futures account to trade the markets in this post. The RMB Group has been helping our clientele trade futures and options since 1991. RMB Group brokers are familiar with the option strategies described in this report. Call us toll-free at 800-345-7026 or 312-373-4970 (direct) for more information and/or to open a trading account. Or visit our website at www.rmbgroup.com. Want to know more about trading futures and options? Download our FREE Report, the RMB Group “Short Course in Futures and Options.”
* * * * * * * *
The RMB Group
222 South Riverside Plaza, Suite 1200, Chicago, IL 60606
This material has been prepared by a sales or trading employee or agent of R.J. O’Brien & Associates (“RJO”)/RMB Group and is, or is in the nature of, a solicitation. This material is not a research report prepared by a Research Department. By accepting this communication, you agree that you are an experienced user of the futures markets, capable of making independent trading decisions, and agree that you are not, and will not, rely solely on this communication in making trading decisions.
DISTRIBUTION IN SOME JURISDICTIONS MAY BE PROHIBITED OR RESTRICTED BY LAW. PERSONS IN POSSESSION OF THIS COMMUNICATION INDIRECTLY SHOULD INFORM THEMSELVES ABOUT AND OBSERVE ANY SUCH PROHIBITION OR RESTRICTIONS. TO THE EXTENT THAT YOU HAVE RECEIVED THIS COMMUNICATION INDIRECTLY AND SOLICITATIONS ARE PROHIBITED IN YOUR JURISDICTION WITHOUT REGISTRATION, THE MARKET COMMENTARY IN THIS COMMUNICATION SHOULD NOT BE CONSIDERED A SOLICITATION.
The risk of loss in trading futures and/or options is substantial and each investor and/or trader must consider whether this is a suitable investment. Past performance, whether actual or indicated by simulated historical tests of strategies, is not indicative of future results. Trading advice is based on information taken from trades and statistical services and other sources that RJO/RMB believes are reliable. We do not guarantee that such information is accurate or complete and it should not be relied upon as such. Trading advice reflects our good faith judgment at a specific time and is subject to change without notice. There is no guarantee that the advice we give will result in profitable trades.