April showers bring May flowers, but will a budding bull market in commodities bloom this May? Emerging green shoots in gold, silver and crude oil could be early signs that the deep freeze gripping commodities since Spring 2011 is finally thawing. At the same time, more mature bull markets in El Niño-impacted commodities like sugar and soybean oil offer hope for long-suffering commodity bulls eager for the start of summer.
Weather Will Determine Direction of Key Commodities in 2016 was our first Big Move Trade Alert of the year. In it we examined the potential effects of the strongest El Niño since 1998. We came to the conclusion that this powerful weather phenomenon would impact tropical commodities the most and, for the most part, this has played out. El Niño may be fading, but its effects continue to be felt in key South American growing regions as well as across the Pacific.
Drier-than-normal conditions in key sugar-producing areas of Brazil and palm oil-producing Malaysia and Indonesia have fueled rather robust bull markets. These same conditions have the potential to give cotton and coffee prices a jolt as well. RMB clients who have followed our recommendations are long sugar, cotton and soybean oil using long-dated call options. We continue to monitor coffee closely too.
Dollar In Driver’s Seat
While weather will continue to be a major factor for certain commodities, the dollar will determine the direction of the sector as a whole. Essential commodities like crude oil and agricultural products are priced in dollars. It takes fewer dollars to buy them when the dollar is strong and more dollars to buy them when it’s weak. This makes the performance of commodities as an asset class extremely dependent on the fate of the world’s number one reserve currency. Precious metals and crude oil are tied to the dollar, so it is not surprising that weakness in the greenback coincides with recent strength in gold, silver, platinum and petroleum.
A strong dollar has been blamed for virtually all that ails the global economy. But as the chart below illustrates, the big bad buck hasn’t been either for over a year. Stuck in a wide trading range, the dollar hasn’t gone anywhere. Instead, it seems to either be consolidating for a move higher or tracing out a definitive top. Two consecutively lower closes below the greenback’s key 38-week moving average and a long-term uptrend line have tilted the odds in the bears’ favor.
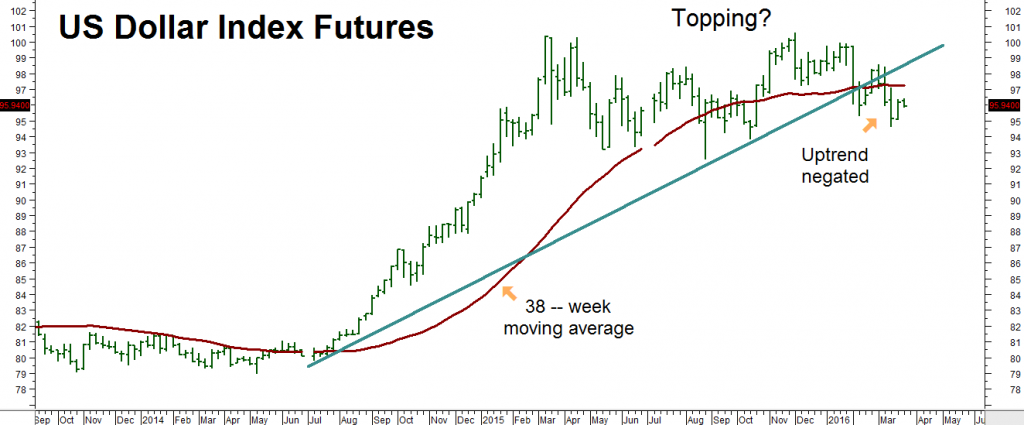
Data Source: Reuters / E-Signal
Fed Chairman Janet Yellen’s late-March transformation from a monetary policy pragmatist into a born-again, interest-rate dove coincided a little too closely with European Central Bank President Mario Draghi’s promise not to ease further after he dropped short term rates to negative 40 basis points in March. Hmmm.
Are the suddenly dovish Yellen and increasingly hawkish Draghi coordinating policy to weaken the dollar and relieve the crushing load of dollar-denominated debt on emerging market economies? If so, the dollar’s days are numbered and a new bull market in commodities is being born. Emerging market currencies have been the biggest beneficiaries so far – particularly the Brazilian Real, which soared 10.1% during the first quarter.
Dollar Index futures ended January at .9965 and finished the first quarter on March 31 at .9457 – a decline of 5%. Taking their cue from the sinking buck, certain key commodities performed well: Crude oil rose 10.6%, gold climbed 9.6%, soybean oil gained 9.7% and sugar soared 17.4% during the same timeframe.
Continued dollar weakness has the potential to blow a hole in the nearly universal predictions of worldwide slowdown and Japan-like global deflation which dominated just a few short weeks ago. It is still too early to tell, but if the first three months of 2016 are any indication, the next “flation” the doom and gloomers will fixate on will begin with “in” instead of “de.”
Three Commodities Leading the Way
Let’s look at several commodities we favor right now and see how they ended the quarter on March 31, 2016:
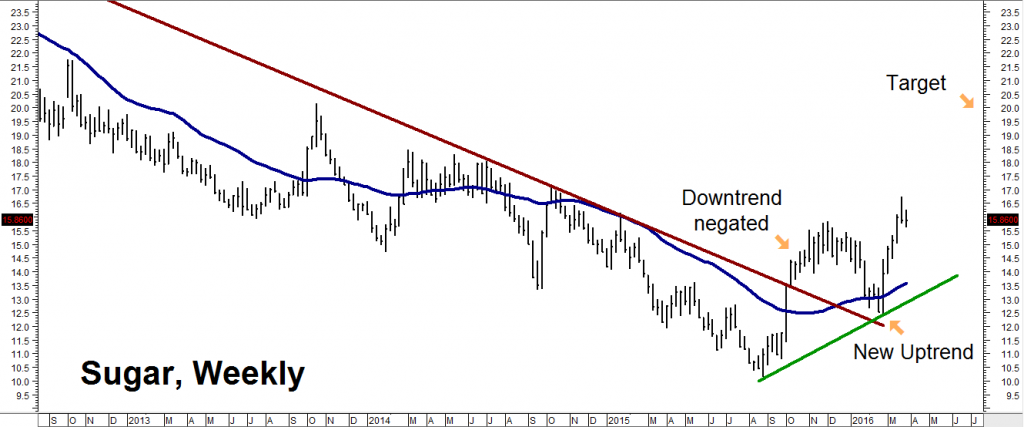
Data Source: Reuters / E-Signal
Sugar was one of the first movers of the commodity sector, negating a long-term downtrend in early October after closing above its 38-week moving average (blue line). It re-tested both in late February and bounced smartly, making new swing highs in the process and confirming the beginning of a new uptrend. We think there is more to go. Our target remains 20 cents.
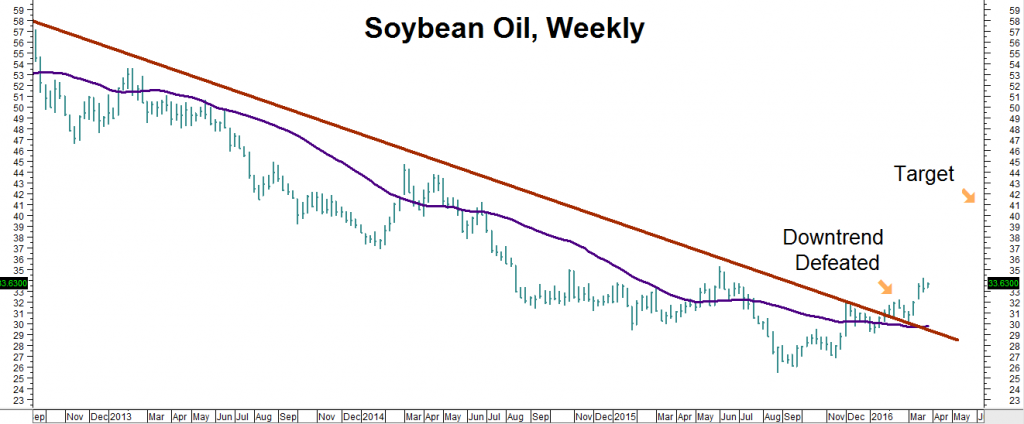
Data Source: Reuters / E-Signal
The soybean oil chart looks a lot like the sugar chart did three months ago. The sweet stuff is in a stronger technical position now, but the future looks pretty bright for our upside target of 42 cents per pound in soybean oil as well.
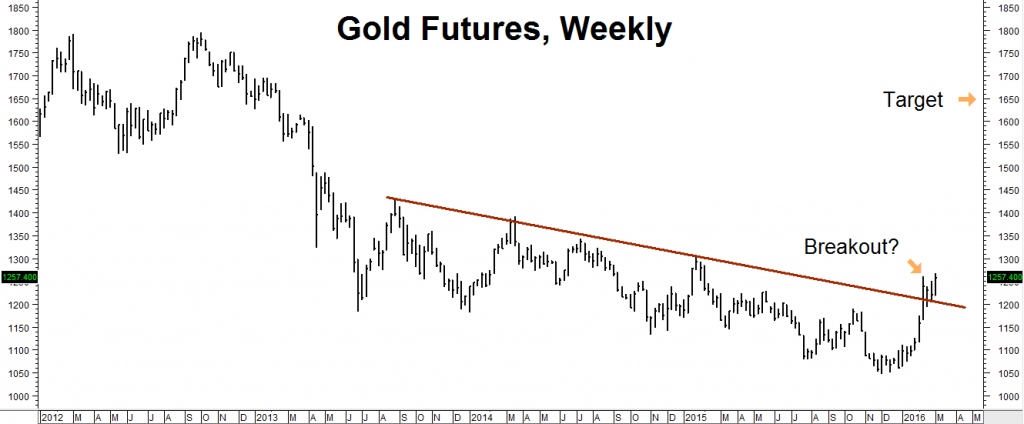
Data Source: Reuters / E-Signal
Gold began the year with the largest first quarter gains in 30 years. While this market was a bit overbought in late March, the Midas metal is looking better from a technical perspective than it has in a long time. Gold needs to close twice consecutively over old swing highs at $1,304 per ounce to confirm its first quarter upside breakout. Next targets would be $1,344 and $1,392 and $1,428. Our long-term target is $1,650.
RMB Group clients who followed our bullish long-term option strategies in Big Move Trade Alert #3 should continue to hold their bullish long-term call spreads and call / put combinations. We think silver can do even better than gold so customers holding similar positions in silver from BMT Alert #2 should consider holding onto their long-term silver positions as well.
Baltic Dry Index Is Encouraging
The Baltic Dry Index is an indicator which measures the movement of raw materials – like grain and iron ore – via the sea. Strong readings indicate a healthy demand for bulk shipping typically associated with a vibrant global economy. Weak readings suggest the opposite.
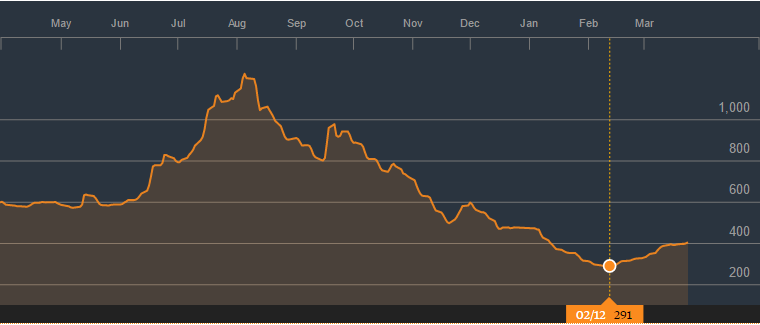
The Baltic Dry Index collapsed during the second half of 2015, falling from a high of 1220 to a low of 290 in mid-February. This 76% decline occurred in just six months. The Index has bounced since then, rising to 440 as of April 4 for a gain of 51.7%. This is a good sign that global trade is on the upswing and should be positive for commodities going forward.
Grain prices are at or near the cost of production. Sixty percent of the increase in global oil demand comes from Asia. And Asia is still growing – led by the ongoing transformation of China from an export to services economy. China will continue to grow as the bulk of the world’s population becomes accustomed to the Western lifestyle – escalating the demand for more meat, grain, water and energy.
Baltic Dry Index
Source: Bloomberg
What To Do Now
We still like the long side of gold, silver, soybean oil and sugar and would strongly consider using downward corrections in these markets as opportunities to establish new positions. We are also watching corn, wheat and cotton very closely. These commodities are unloved and close to the cost of production. Shrinking volatility means call options in all three of these markets are relatively cheap.
We also recommend taking a look at commodity-focused managed futures accounts. These typically offer superb diversification and can be a nice antidote to unsettling volatility in the stock and bond markets as this crazy election year unfolds.
Getting Started
Give RMB Group a call at 800-345-7026 or 312-373-4970 if you would like to learn more about the CTAs we are following right now. To find out how individually managed futures accounts can work for you, download our free booklet and accompanying video – Opportunities Outside the Stock Market – now.
—
The RMB Group
222 South Riverside Plaza, Suite 1200, Chicago, IL 60606
This material has been prepared by a sales or trading employee or agent of R.J. O’Brien and is, or is in the nature of, a solicitation. This material is not a research report prepared by R.J. O’Brien’s Research Department. By accepting this communication, you agree that you are an experienced user of the futures markets, capable of making independent trading decisions, and agree that you are not, and will not, rely solely on this communication in making trading decisions.
DISTRIBUTION IN SOME JURISDICTIONS MAY BE PROHIBITED OR RESTRICTED BY LAW. PERSONS IN POSSESSION OF THIS COMMUNICATION INDIRECTLY SHOULD INFORM THEMSELVES ABOUT AND OBSERVE ANY SUCH PROHIBITION OR RESTRICTIONS. TO THE EXTENT THAT YOU HAVE RECEIVED THIS COMMUNICATION INDIRECTLY AND SOLICITATIONS ARE PROHIBITED IN YOUR JURISDICTION WITHOUT REGISTRATION, THE MARKET COMMENTARY IN THIS COMMUNICATION SHOULD NOT BE CONSIDERED A SOLICITATION.
The risk of loss in trading futures and/or options is substantial and each investor and/or trader must consider whether this is a suitable investment. Past performance, whether actual or indicated by simulated historical tests of strategies, is not indicative of future results. Trading advice is based on information taken from trades and statistical services and other sources that R.J. O’Brien believes are reliable. We do not guarantee that such information is accurate or complete and it should not be relied upon as such. Trading advice reflects our good faith judgment at a specific time and is subject to change without notice. There is no guarantee that the advice we give will result in profitable trades.
This report was written by Investors Publishing Services, Inc. (IPS). © Copyright 2016 Investors Publishing Services, Inc. All rights reserved. The opinions contained herein do not necessarily reflect the views of any individual or other organization. Material was gathered from sources believed to be reliable; however no guarantee to its accuracy is made. The editors of this report, separate and apart from their work with IPS, are registered commodity account executives with R.J. O’Brien. R.J. O’Brien neither endorses nor assumes any responsibility for the trading advice contained therein. Privacy policy is available on request.