Last year will go down as one of the worst for commodities. The slowdown in China and the strong US dollar were a brutal tag-team, decimating most commodity markets. Crude may have gotten all the press – the black, sticky stuff shed 30.5 % in 2015 – but it wasn’t the only victim. Precious metals didn’t fare so well either. Gold and silver dropped over 10% in the old year, but the prices of their hybrid industrial cousins were far worse: platinum shed 26% and palladium got pounded, ending 2015 down over 30%.
Big Ag took it on the chin as well: corn shucked off 9.5%, soybeans sagged 14.5% and wheat got whacked, losing 20% over the course of 2015. Things were even worse in the barnyard. Live cattle shed 21% while live hogs dropped nearly 26%.
The only commodities immune to last year’s swoon were tropical, known by traders as “softs.” Sugar gained 5% and frozen concentrate orange juice futures finished flat despite gale-like headwinds from the collapsing Brazilian Real. (Brazil is the globe’s largest supplier of both commodities.) Cocoa and cotton also chalked up 9.5% gains. Why did the “softs” outperform other commodities in 2015? Blame it on El Niño.

Source: NASA Satellite Image
The graphic above compares the El Niño of 1997 – one of the largest on record – with the current event. The red and white colors indicate heat and sea height. Not only is the current El Niño stronger than 1997, it is also much larger, spreading over an area bigger than the entire United States. It also appears to have more staying power. Water temperature and sea height would normally be declining right now. They are not.
This means El Niño could continue to disrupt weather patterns well into the New Year. Most of this disruption occurs in the tropics, which is why tropical commodities have outperformed their temperate-zone cousins. Damaging rains in Brazil, drought in the wheat growing areas of Australia, and disruption of monsoon rains in India and southwest Asia are all associated with El Niño.
We Still Like Bullish Sugar, Cotton & Wheat Positions
El Niño was the major focus of our Big Move Trade Alerts for the second half of 2015 and will remain squarely in our sights for the first half of the New Year. We highlighted El Niño and its potential effects on tropical commodities in July (Alert #18). In that Alert we recommended buying long-dated March 2017 calls on both sugar and cotton for roughly $900 each. (Click here to read as part of our “El Niño Power-Pak.”) Traders who are looking for a low-risk El Niño play should consider re-reading this report.
Our sugar calls closed yesterday at $1,478. Our cotton calls finished at $720. We still like both of these positions, but would adjust the strike price of the long-dated sugar call to lower initial risk. (Your personal RMB Group Broker can help you with this.)
Here’s what the long-term chart of sugar looks like right now:
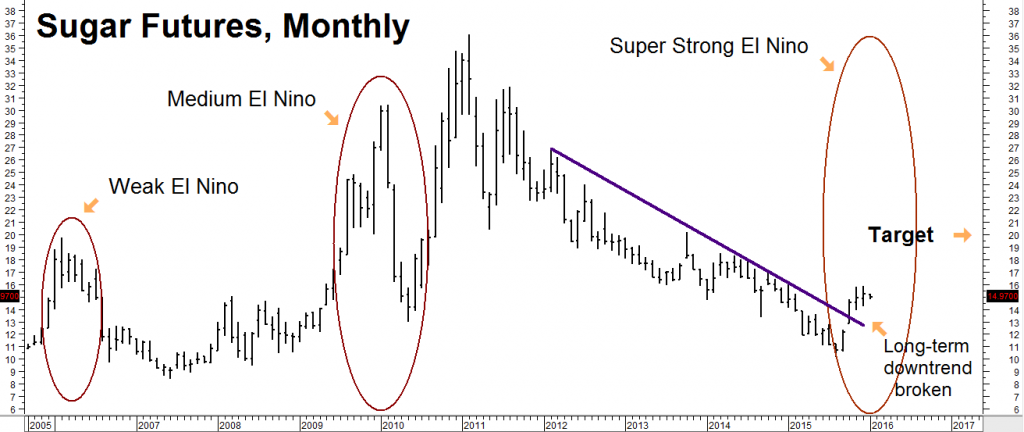
Data Source: Reuters/E-Signal
Sugar has negated its long-term downtrend, closing above its multi-year downtrend for three months in a row. El Niño-inspired torrential rains in Brazil have added to fears about the current crop, causing the sweet stuff to rally despite the virtual destruction of the Brazilian Real. Our long-term target remains 20 cents. However, a stronger Real would add as much as 5 cents to our target – making the call options we suggested purchasing last summer worth as much as $11,200.
Sounds far-fetched? Take a look at what happened during the last moderate El Niño event. While there is no guarantee it will repeat, the current El Niño is much more robust and could end up being the strongest ever recorded. Twenty-five cents may be an aggressive target, but it is certainly possible give current conditions.
Take a look at the long-term chart of cotton is right now:
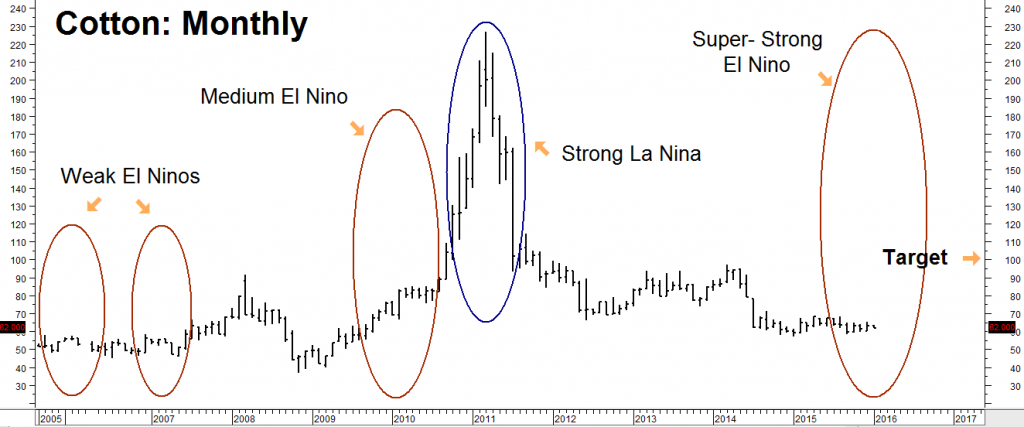
Data Source: Reuters/E-Signal
The white fluffy stuff remains static; it is trading in a narrow range close to support just above the lows. Cotton may not be as closely correlated with El Niño as sugar, but it’s what happens after El Niño that most interests us. El Niño events are typically followed by their opposite, La Niña. La Niña is associated with dryness in key cotton-growing areas, especially North America. The strong La Niña of 2010-2011 which followed on the heels of the 2009-2010 El Niño played a huge role in the cotton rally of early 2011.
So why go long cotton now? Because volatility is extremely low and option prices are cheap. We can buy March 2017, 75-cent cotton calls right now for $720. This gives us 13 months of upside exposure to a traditionally volatile and potentially explosive market for a relative pittance. Only 14% out-of-the-money, these options could get real expensive, real fast should any weather disruptions nudge cotton higher.
We added wheat to our El Niño Power-Pak in October’s Alert #22. (Click here to read.) The chart of wheat below shows the same kind of reaction to the El Niño / La Niña cycle we see in cotton – only in different years. Wheat begins moving up during an El Niño year and then rises again once the hotter, drier La Niña pattern returns.
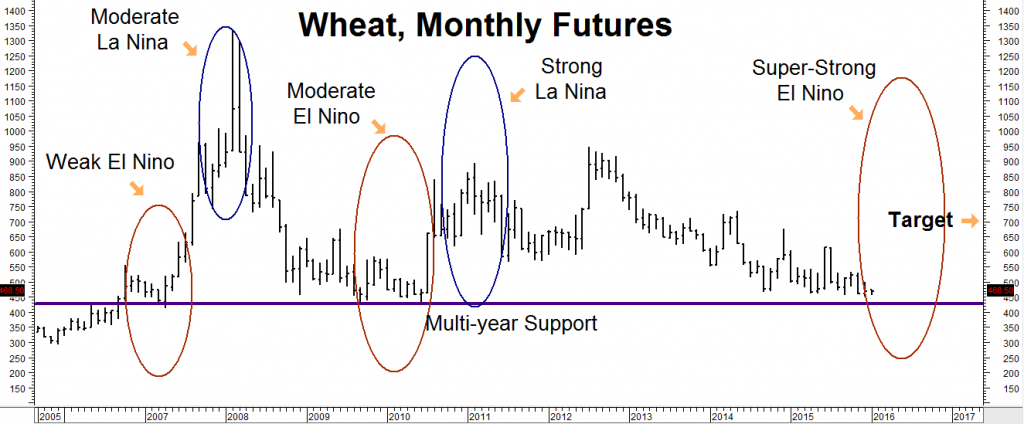
Data Source: Reuters/E-Signal
We continue to like the December 2016 $6.00 / $7.00 bull spreads we suggested purchasing for $900 or less back in October. Currently trading at $550, these spreads could be worth as much as $5,000 should the wavy grain hit our $7.00 per bushel target prior to option expiration on November 26, 2016.
Weather Worries Could Also Dominate Second Half of 2016
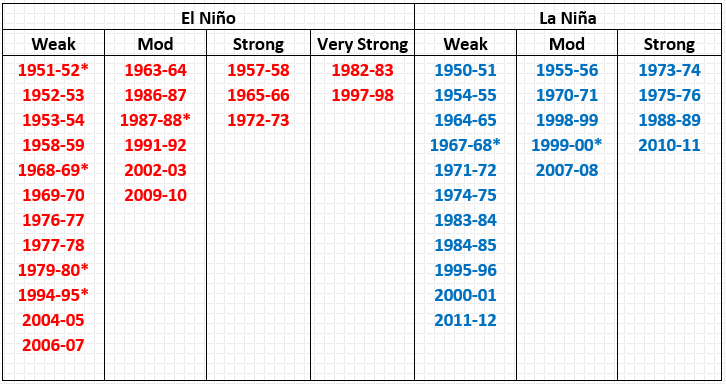
Source: Golden Gate Weather Services
The table above is from our July Alert when we first discussed El Niño. Take a look at the dates listed in red and compare them to the dates in blue, and you’ll see a pattern emerge. El Niño is followed by its little sister, La Niña, in the majority of cases. El Niño tends to have outsized effects on tropical commodities, but La Niña is the real disrupter when it comes to North America. The drought and heat generated by La Niña can cause big moves in soybeans and corn as you’ll see in the chart below:
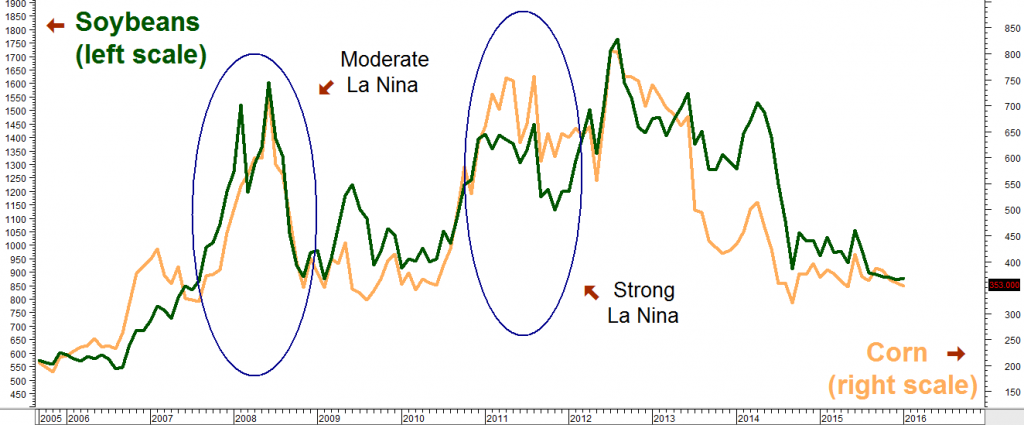
Data Source: Reuters/E-Signal
El Niño may be getting all the attention now, but little sister La Niña could stir up the pot weather-wise in the second half of the year. We are already long corn based on the changing dietary habits of China and the rest of Asia. (Click here to read “Investing on the New Gold: Protein”) We’ll look to add to these positions and bring soybeans into the mix as 2016 progresses.
In the meantime we are going to ignore the bearish chorus in the commodity sector. Commodities are cheap, hated and extremely oversold. That fact that nobody is showing them any love makes us like them even more. Consequently, we will continue to recommend fixed-risk, low cost long positions in sugar, cotton, wheat and corn.
You can establish a reasonable long positions in all four of these markets right now for a total cost of $3,700 or less. These bargains won’t be around much longer if Mother Nature continues her disruptive ways. If we are wrong, the most we can lose is $3,700 plus transaction cost.
Getting Started
RMB Group customers interested in this El Niño play should contact their personal RMB Group broker. If you do not have an account with us, you need a futures account to trade the recommendations in this report.
The RMB Group has been helping their clients trade futures and options since 1984 and are very familiar with long-term “Big Move Trade” strategies. Call us toll-free at 800-345-7026 or 312-373-4970 direct to learn more. We’ll send you everything you need to get started. You can also visit www.rmbgroup.com to open an account online.
If you are new to futures and options and want to learn more about them, download the “RMB Short Course in Futures and Options” – our easy-to-read guide covering all the basics. Call us toll-free at 800-345-7026 or 312-373-4970 direct or go to our website www.rmbgroup.com. Click the “Education Tools” tab at the top of the home page, scroll down to find the report and click on it.