The need for food is unrelenting and universal. It has been the force behind mass migrations and wars. English cleric and scholar Thomas Malthus (1766-1834) was fascinated by the relationship between population and food. He believed food production increased arithmetically while human populations grew geometrically, and predicted humans would have to 1) limit their population growth voluntarily, or 2) have it limited for them naturally by scarcity, famine and disease.
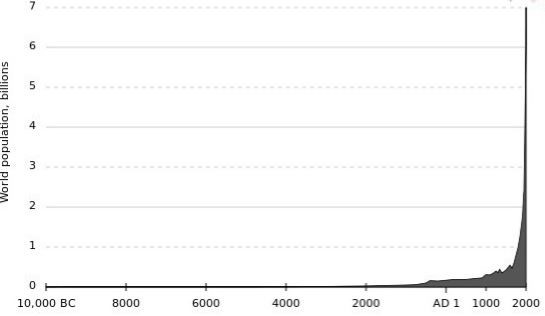
What Thomas Malthus didn’t see coming was the discovery of crude oil (and other hydrocarbons such as natural gas) which enabled humans in developed nations to dramatically increase food production to levels inconceivable in his era. The chart below shows the impact of this discovery. Crude began flowing from the first commercial well in Titusville, Pennsylvania in August 1859. In 1850, world population was 1.2 billion. Today it is 7 billion. Poor Malthus got blindsided by the future.
Today “Malthusian” is an often derogatory term hurled at those predicting catastrophe of any kind. Its implicit message? We will find a way to keep feeding our growing population no matter what. All we have to do is wait for the next big discovery.
We are not predicting catastrophe. But having enough food – at least in the developed world – is not the same as having cheap food. We believe there are a number of factors coming together right now that have the potential to greatly impact the cost of what we need to survive, not the least of which is the connection between the price of grain and the price of hydrocarbons – especially crude oil and natural gas. This makes sense because farm productivity relies on two key factors: mechanization and fertilizer. Crude oil produces the diesel fuel to drive the former. Natural gas provides the nitrogen to enrich the latter. Higher energy costs directly impact the price of food.
Crude / Corn Connection
The chart below shows the correlation between corn and crude oil prices through from 2004. This correlation has broken down in recent months. Crude prices have been cut in half but the price of corn is stabilizing. Could the yellow grain be leading crude higher? It may be too soon to tell but it wouldn’t be the first time. Corn led crude higher in the fall of 2010 and again in 2011.
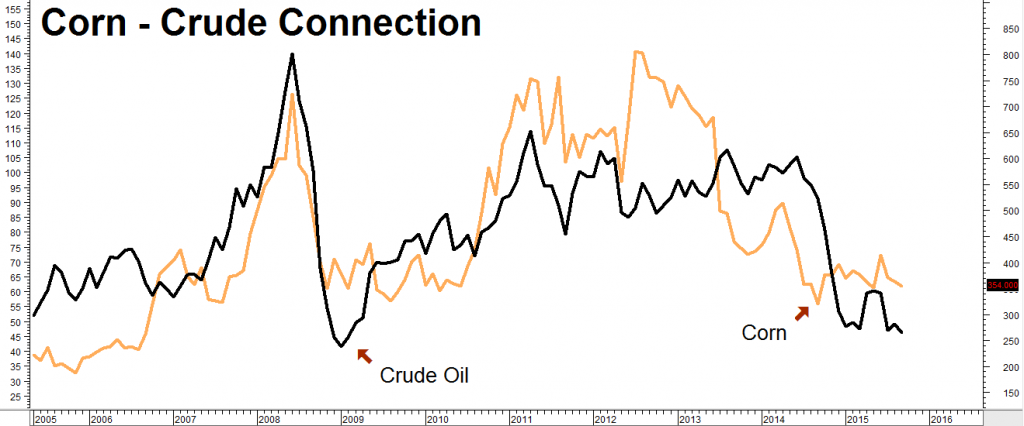
Data Source: Reuters/Datastream
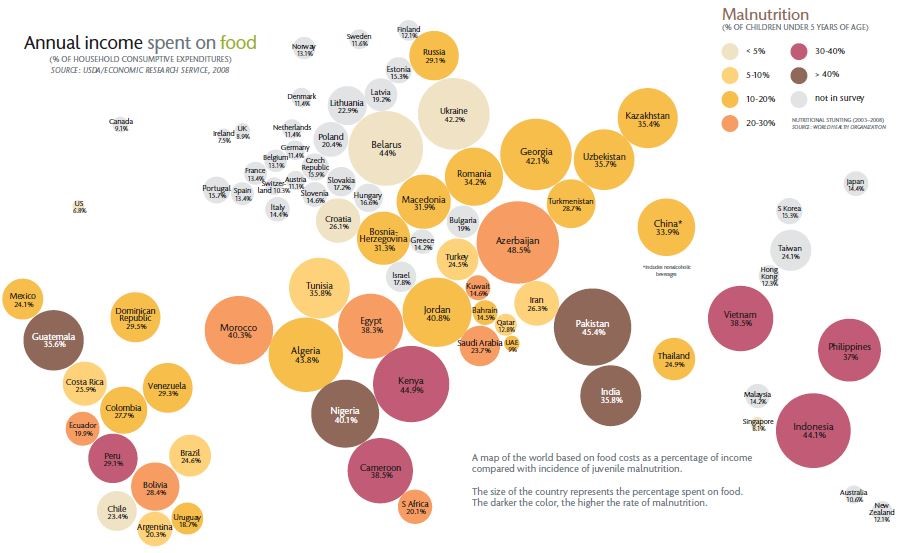
Perhaps the most ironic part of the crude-corn connection is the relationship between high oil prices and the price of food in oil-producing economies. The graph below shows the percentage of income spent on food in nearly every major nation – the larger the circle, the bigger the percentage.
Hungry people are angry people, so we are not surprised that the countries who spend more money on food tend to be those either involved in, on the brink of, or just recovering from violent internal clashes. Unfortunately, we expect to see more of this as prices climb.
Since many of these violent clashes are occurring in the oil-rich Mideast, we don’t expect crude oil prices to drop much further any time soon. Our real fear is a cycle of violence, leading to higher crude oil and food prices which sow the seeds for even more violence.
Where’s the Beef (and Pork and Chicken)?
The world – particularly China who has managed to feed 25% of the world’s population on just 7% of the planet’s arable land – has done a pretty good job of producing food. However, the newfound prosperity of the Middle Kingdom and the rest of Asia is changing dietary habits. Populations in developing countries are consuming more meat. A meat-rich diet requires far more fertilizer and water than one based on grains and legumes.
Meat is grain (and water) in another package. It takes 4.5 pounds of grain to produce 1 pound of chicken meat; 7.3 pounds to produce 1 pound of pork; and 20 pounds to produce 1 pound of beef. Only 4% of the protein in corn is converted to edible protein in beef. It’s just 10% in pork and 20% in chicken.
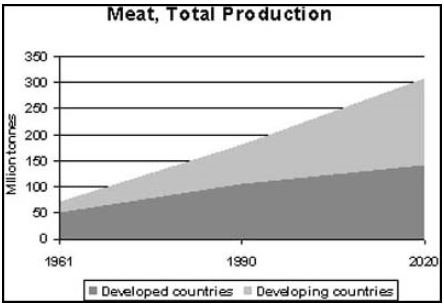
The global demand for animal protein is increasing rapidly according to the Food and Agriculture Organization of the United Nations (FAO). Global consumption of meat increased from about 100 to 235 tons from 1970-2000 and continues to climb. In the meat-eating US, livestock consumes 7 times the amount of grain consumed directly by America’s entire human population. While Asia hasn’t approached this level yet, its higher standard of living means the demand for meat will continue to rise.
While the Chinese prefer pork, their demand for beef – the least protein-efficient meat – is pegged to increase substantially by the USDA, jacking up imports from 75,000 to a record 500,000 tons. There’s a whole lot of grain tied up in those numbers.
The desire to eat more meat increases the demand for more grain. More grain requires more arable land and more water. Both are currently in short supply in China. China recently admitted that 19% of its farmland was polluted and that 8% – roughly 8 million acres – was too polluted to grow anything.
And we haven’t even mentioned water… The Chinese economic juggernaut has left watersheds depleted and many sources of aboveground water polluted. Not only is China losing farmland, it is losing the ability to adequately irrigate what’s left.
Six Reasons to Worry About Chinese Agriculture
(From “Mother Jones” August 21, 2013)
1. China’s farmland is shrinking. Despite the country’s immense geographical footprint, there just isn’t that much to go around. Between 1997 and 2008, China saw 6.2 percent of its farmland engulfed by what the government calls “planned ecological cropland conversion,” the FAO/OECD report states. As this 2011 paper from the Land Deals Politics Initiative (LDPI) shows, industrialization and sprawl have driven a substantial amount of recent farmland loss.
2. The United States has six times the arable land per capita as China. Today, the FAO/OECD report states, China has just 0.09 hectares of arable land per capita—less than half of the global average and a quarter of the average for OECD member countries.
3. A fifth of China’s land is polluted. The FAO/OECD report gingerly calls this problem the “declining trend in soil quality.” Fully 40 percent of China’s arable land has been degraded by some combination of erosion, salinization, or acidification—and nearly 20 percent is polluted, whether by industrial effluent, sewage, excessive farm chemicals, or mining runoff, the FAO/OECD report found.
4. China considers its soil problems “state secrets.” The Chinese government conducted a national survey of soil pollution in 2006, but it has refused to release the results. Evidence is building that soil toxicity is a major problem creeping into the food supply. In May 2013, food safety officials in the southern city of Guangzhou found heightened levels of cadmium, a carcinogenic heavy metal, in 8 of 18 rice samples picked up at local restaurants, sparking a national furor. The rice came from Hunan province—where “expanding factories, smelters and mines jostle with paddy fields,” the New York Times reported. In 2011, Nanjing Agricultural University researchers came out with a report claiming they had found cadmium in 10 percent of rice samples nationwide and 60 percent of samples from southern China.
5. China’s food system is powered by coal. It’s not just industry that’s degrading the water and land China relies on for food. It’s also agriculture. China’s food production miracle has been driven by an ever-increasing annual cascade of synthetic nitrogen fertilizer (it uses more than a third of global nitrogen output)—and its nitrogen industry relies on coal for 70 percent of its energy needs. To grow its food, in other words, China relies on an energy source that competes aggressively with farming for water.
6. Five of China’s largest lakes have substantial dead zones caused by fertilizer runoff. That’s what a paper by Chinese and University of California researchers found after they examined Chinese lakes in 2008. And heavy use of nitrogen fertilizer takes its toll on soil quality, too. It causes pH levels to drop, turning soil acidic and less productive—a problem rampant in China. Here’s a 2010 Nature article on a national survey of the nation’s farmland.
The team’s results show that extensive [fertilizer] overuse has caused the pH of soil across China to drop by roughly 0.5, with some soils reaching a pH of 5.07 (nearly neutral soils of pH 6-7 are optimal for cereals, such as rice and grain, and other cash crops). By contrast, soil left to its own devices would take at least 100 years to acidify by this amount. The acidification has already lessened crop production by 30-50% in some areas, Zhang [a Chinese researcher] says. If the trend continues, some regions could eventually see the soil pH drop to as low as 3. “No crop can grow at this level of acidification,” he warns.
China has not lost the ability to feed itself yet – it is still one of the world’s biggest corn producers – but bigger demand combined with shrinking acreage and lack of water pose a threat. Consequently, we expect to see a steady increase in Chinese imports of critical agricultural products, including grains and oilseeds, and the potential for higher prices due to this demand.
Corn and Climate Change
One can debate the causes all they want – how politics got mixed up with weather we have no idea – but we are living in an era of significant climate change. Loss of sea ice, numerous heat (and cold) waves, stronger hurricanes and longer, more severe droughts are all part of the same package. It’s not that these haven’t occurred in the past, but the frequency of these “freak” weather events is climbing.
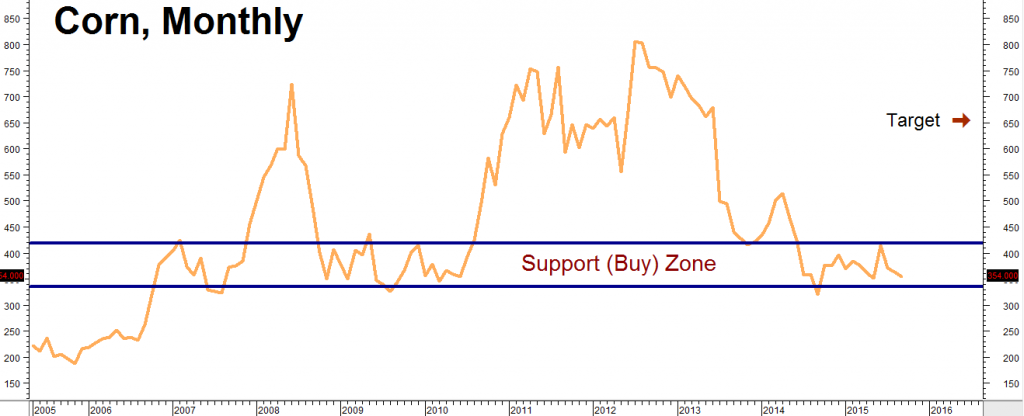
Weather is, by far, the biggest factor in the price of grain. On the chart below, notice how much more volatile corn prices have been since the 2008 drought compared to the period prior. This is mainly due to weather. Good growing conditions returned in 2009 and 2010 only to be replaced by major climatic events in 2011 and 2012. What will the next 12 months bring? Only Mother Nature knows for sure. However, there is no question that the weather (and corn prices!) are much more volatile.
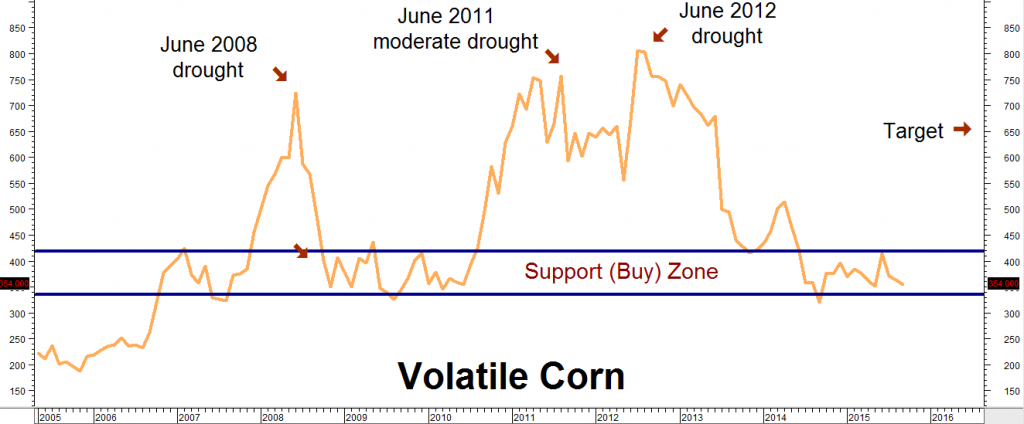
Data Source: Reuters/Datastream
Peaks in the price of corn tend to occur during the mid-summer maturation phase after which the crop is either “made” or not. Expectations of perfect growing conditions this year have driven the price of the yellow grain into oversold territory right above support at $3.50 per bushel.
Meanwhile, the costs of growing corn are increasing while the price of corn is decreasing. The average cost of growing a bushel of corn is somewhere between $4.23 and $4.29 per bushel according to two popular farm publications. This difference between the cost and price of corn is a phenomenon that cannot last forever.
As the chart above suggests, summer expectations – bullish or bearish – have a pronounced tendency to reverse themselves over the course of the next few months and years. We would not be surprised to see a similar reversal from the current support zone as well.
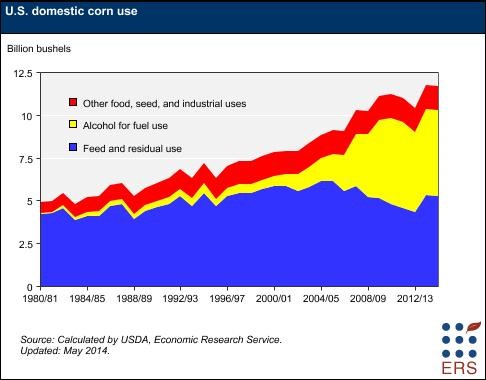
Most of the corn grown in the United States is used to either feed livestock or to make ethanol. Roughly 1/3rd of the crop is dedicated to the latter and that percentage appears to be growing. The more a gallon of gas costs, the more profitable it is to mix cheaper ethanol into it. It is yet another reason why high crude oil prices tend to reinforce higher corn prices in a normal environment.
What Will El Niño’s Impact Be?
Many forecasters are predicting the return of El Niño this year. El Niño is a weather phenomenon that results in higher temperatures in the Eastern Pacific (off the Western North and South American coasts) and lower water temperatures in the Western pacific. El Niño is associated with drought-like conditions in corn-growing areas of China. China has already increased corn imports over 200% due to many of the problems we highlighted earlier. A drought on top of all this would be devastating. However, China’s huge foreign reserves would enable it to make up the difference by purchasing corn from Argentina, Brazil and the US, helping to support prices on this side of the Pacific.
El Niños are also known to delay or disrupt the Asian Monsoon, potentially impacting food production in India – home to 1.25 billion people and the world’s second most populous country after China. Past El Niños have been associated with drought in Australia, affecting key wheat growing areas and creating an environment for catastrophic bush fires.
Why Protein is the New Gold
Corn is consumed. That means it will react much more rapidly to supply and demand than physical gold. Changing diets in China, India and the rest of the developing world are increasing the demand for meat. More meat requires more grain. More grain requires more arable land and more water, both of which are in short supply in the developing world – especially China.
The US is the world’s largest producer and exporter of corn, but most of it is earmarked to feed domestic livestock and make ethanol to blend into gasoline. The world’s second largest producer of corn, China, has by its own admission polluted nearly 20% of its cropland and could face El Niño-inspired drought conditions for the next two years. That leaves America as the “go to” source in case of an emergency.
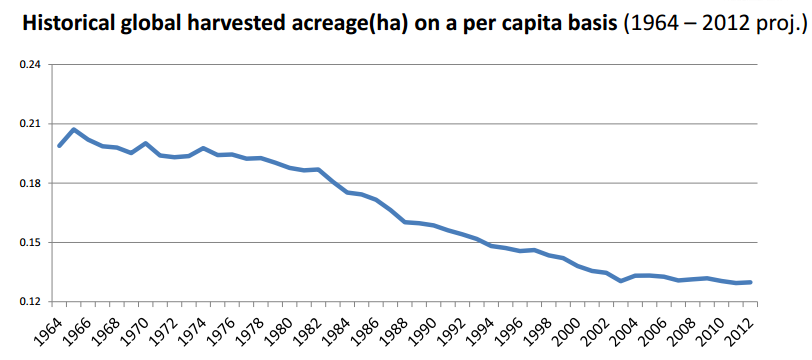
Corn requires lots of arable land. The US has plenty, but not all big corn consumers do. The graph above shows the effects of a growing population on the shrinking supply of land. Harvested acres per person have dropped 40% in the last half of a century. Some of this drop can be attributed to advances in technology, including genetically modified hybrids, but not all of it. The developing world is losing farmland at the same time diets are changing. Odds are it will need to rely on big North and South American crops in order to meet demand.
USDA expectations for a big American crop have left corn much cheaper on a relative basis than gold. Near-perfect growing condition in the corn-producing regions of the US have driven the price of the golden grain down to levels not seen since summer 2010 – just before the big 2011 run-up.
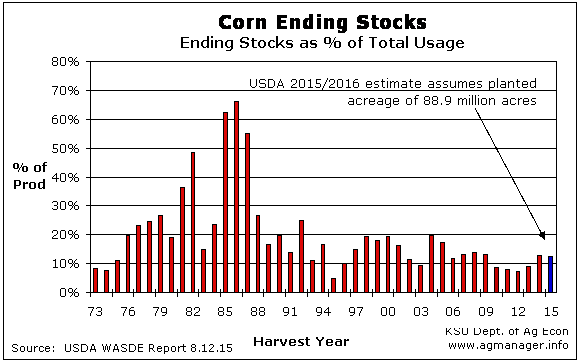
Even if the forecast for a big US crop pans out, global stockpiles will be at a relatively low level. This will leave the market vulnerable to any bullish surprises and continue the volatility that has defined it since 2005. The USDA estimates corn ending stocks as a percentage of global demand to be at roughly the same level they were in 2009 during the last cyclical low in price – and that’s with a record US crop this year.
“Harvest” Your Own Corn Crop for Pennies on the Dollar
Recent weakness in the golden grain is giving us the opportunity to take a long term, low cost bullish position with the potential to pay off substantially should corn continue its volatile, roller-coaster ride and rebound from current levels. We’ve chosen corn because it is cheaper on a relative basis than wheat and soybeans although many of the same, long-term bullish forces are at work in these markets as well. Corn is also the beneficiary of American ethanol demand. This keeps huge amounts off the international market and helps support price.
So how do we play it? Instead of sinking a lot of capital into expensive farmland or buying agricultural companies whose stocks may or may not rise with the price of corn, we “rent” the golden grain for approximately two years. How do we do that? By using corn options traded on the Chicago Board of Trade (CBOT).
Since corn displays a fairly solid tendency to peak during summer months, we use long-dated July 2017 options. Each CBOT option covers 5,000 bushels of corn and is priced in cents per bushel. Our price target of $6.50 per bushel are dependent on how the potentially bullish factors outlined in this report play out. A major weather event could send prices even higher.
We are recommending our trading customers consider is an option spread designed for our $6.50 per bushel target and has a cost and risk (based on current prices) of roughly $800 with a potential to be worth as much as $7,500 should our $6.50 target be reached prior to July 2017 option expiration on June 23, 2017.
Failure of the market to rally means we lose the amount we pay for our option strategies (plus transaction costs) but no more. Prices can and do change so RMB Group trading customers should check with their personal broker for the specifics of the trade suggested above. Consider purchasing one position for each $50,000 in your underlying portfolio value. This gives you big exposure to this critical, severely oversold commodity for an annualized percentage risk of roughly 0.6% Prices can and do change, so check with your broker for the latest update.