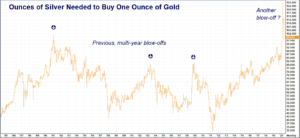
Silver is finally gaining on gold, reversing nearly all of its richer cousin’s gains since silver’s coronavirus collapse. It took 125 ounces of silver to buy one ounce of gold barely a month ago. This drove the gold/silver ratio far above its previous all-time highs. It now takes 97.38 ounces of silver to buy one ounce of gold. This is a sharp downward reversal of 22%, over half of which has occurred in the last three days. This volatile price action has all the characteristics of a classic “blow-off.”

Data Source: Futuresource
Blow-offs in the gold/silver ratio are rare and nearly always game-changing. While the past is not a perfect predictor of the future, we view the blow-off happening now as a powerful signal that silver is shifting into higher gear as it rallies to catch up with gold. This fundamental change in the relationship between these two metals could last for years.
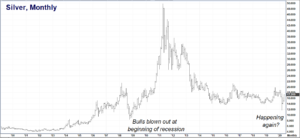
Blow-off tops (marked by arrows in the 35-year chart of the gold/silver ratio above) tend to correspond with the early innings of a major, bull market in silver. Perhaps the one that interests us most is the decline that took the ratio from a high of 82 to a low of 32. This decline corresponded with a powerful rally that saw silver soar from a low just above $8.00 per ounce in 2008 to a high just below $50 per ounce in early 2011.
2008 marked the beginning of the “Great Recession.” 2020 could go down in history as the beginning of what could be an even “Greater Recession.” 2008 was an election year; so is 2020. Stocks crashed in both 2008 and in 2020. The events of 2008/2009 fundamentally changed the global economy. The events of 2020 are doing the same thing. The similarities between these two time periods are uncanny.
Silver got trashed 2008 (see chart below) because of its dual status as both a precious and industrial metal. Fears that an economic slowdown resulting from a crashing stock market would diminish industrial demand for silver sent it sharply lower at the onset of the 2008/2009 recession. COVID-19 did the same thing to silver as well. Prices took out key, multi-year lows, blowing the bulls out of the market in both cases.

Data Source: Futuresource
“The Best Cure for Low Prices Is Low Prices”
This old adage — from a time when traders screamed and gestured at each other while crowded in a trading “pit or “ring” — is just as valid today. Reduced demand leads to lower prices. When prices fall below the level needed to cover costs, production slows to a crawl or stops entirely. Supplies eventually drop far enough to cause a shortage. Shortages cause prices to rise again and begin the cycle anew. In a recession, demand for nearly everything drops. Prices follow.
Falling commodities are one thing, but when the prices of financial assets like stocks, bonds, and real estate get mauled by the bear it sets up a dangerous situation. Financial assets serve as collateral for trillions of dollars in loans. Failure to grow, or at least maintain the value of these assets, causes them to lose their value as collateral. This directly impacts the quality of the loans backed by this collateral. This has the potential to undermine confidence in the holders of these loans which tend to be banks – especially large, global investment banks.
Modern economies cannot function without solvent banks. For banks to stay solvent they need the value of the collateral backing their loans to remain stable. This is why the Fed rescued the banks at the beginning of the “Great Recession.” It is why they continue to fire the money cannons non-stop.
COVID-19 has shut down huge segments of the economy, threatening to drive the value of financial assets sharply lower. The Federal Reserve knows it cannot let this happen and has vowed to support banks. The trillions spent by the Fed to break the tide of falling prices due to COVID-19 is already many times the amount spent in 2008/2009. Expect this to double, and even triple again, before it is over.
The Federal Government, on the sidelines in 2008, is also jumping in and injecting trillions more. Classic price inflation may not be rearing its head yet, but it is alive in a different form. It is manifesting itself in gains for stocks and bonds – both of which are ridiculously (and artificially) expensive at current levels. We believe the huge amount of money being thrown at the problem will eventually lead to the return of classic price inflation.
Jerome Powell’s “Everything” Put Option
The United States Federal Reserve bailed out banks, saved big auto and placed a put option under stocks by purchasing Treasury bonds with its massive quantitative easing (QE) program during the Great Recession. Today it is not only buying bonds, but also corporate debt, municipal debt and boatloads of non-investment grade, junk debt. It is also getting ready to buy ETFs directly for the first time ever. The Fed is worried.
Fed Chairman Jerome Powell vowed in his “60 Minutes” interview on Sunday night to “…not repeat the mistakes of the last depression.” He also said, “The Fed is not out of ammunition by a longshot.” Reading between the lines is not hard. The financial press is attributing yesterday’s huge stock market rally to progress on a potential COVID-19 vaccine. We believe most of the credit should be given to his “60 Minutes” interview.
In that interview and others, Fed Chairman Powell has essentially promised to support prices in nearly every financial asset class. Powell is, in effect, buying a put option under the entire economy. We call it the “everything put.” Put options, like insurance policies, have a price. We believe the price of the Fed’s “everything” put option is inflation. Is silver starting to sniff this out?
Is Silver a Better Inflation Hedge Than Gold?
The relatively paltry stimulus of 2008/2009 eventually generated enough inflation to get silver moving higher – eventually rising to nearly $50 per ounce. Fed stimulus is far more robust today. So is fiscal stimulus. TARP was a $750 billion program. Current stimulus is already 4 times this amount. More is expected to follow. No wonder silver has finally joined its richer cousin to the upside!
We have spoken about how undervalued silver has been to gold at length in previous blogs and have been expecting this undervaluation to reverse. It’s taken longer than we thought, but we believe we’ve just witnessed the beginning of this reversal. We’ve also been recommending long positions in gold for different reasons. Unlike silver which has a big industrial component, gold is primarily a financial metal. This is why it has done so well until now. But periods of inflation are when silver tends to really shine.

Source: BD Swiss
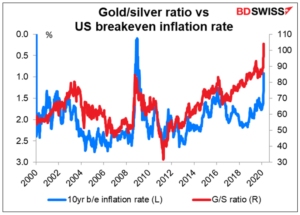
The gold / silver ratio spread is the red line in the chart above. The higher the ratio, the cheaper silver is vis-vis gold. The blue line is the 10-yr breakeven inflation rate. The inflation scale is reversed, so values at the bottom of the chart are higher than those at the top. Breakeven inflation was virtually zero at the beginning of the 2008/2009 recession. This corresponded to a gold/silver ratio of nearly 110, which meant that it took that many ounces of silver to buy one ounce of gold.
The gold/silver ratio reversed in a blow-off similar to the one we just witnessed and continued to decline as inflation rose. Silver began to outperform gold until late 2011 when it took only 32 ounces of silver to buy one ounce of gold. Spot gold closed last night (May 18, 2020) at $1,734.40. The same ratio today would make one ounce of silver worth $52.40 without gold rising one penny more.
Is inflation the magic elixir missing from the current market environment? We believe it is. It was missing at the beginning of the 2008/2009 recession as well. Silver exploded once inflation returned. Will this happen again? It is too early in this recession for it to be noticed yet. That doesn’t mean it has gone away. RMB Group trading customers know that we’ve been recommending long positions in both silver and gold for the past two years. If we were forced to choose just one position today it would be silver – hands down.
Hold Bullish COMEX Option Positions in Silver
RMB Group Trading Customers who don’t currently have long positions in silver may want to consider establishing one soon. The bull call spreads we recommended in our April update of “Silver for Pennies on the Dollar” would be a good place to start. Investors looking for a powerful inflation hedge may want to consider establishing bullish positions using the 5,000-ounce COMEX silver options in this report. RMB Group brokers can help custom-design a bullish option strategy that fits your needs.

Data Source: Reuters/Datastream
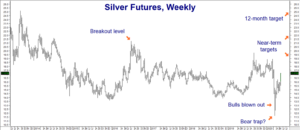
Our near-term targets are $19.25 and $22.00 per ounce respectively. Our 12-month target is $25.00 per ounce. The 2016 highs of $21.23 remain a key level. A breakout above this level could signal a new phase in the current bullish market.
Please be advised that you need a futures account to trade the markets in this post. The RMB Group has been helping our clientele trade futures and options since 1991. RMB Group brokers are familiar with the option strategies described in this report. Call us toll-free at 800-345-7026 or 312-373-4970 (direct) for more information and/or to open a trading account. Or visit our website at www.rmbgroup.com.
Want to know more about trading futures and options? Download our FREE Report, the RMB Group “Short Course in Futures and Options.”
* * * * * * * *
The RMB Group
222 South Riverside Plaza, Suite 1200, Chicago, IL 60606
This material has been prepared by a sales or trading employee or agent of R.J. O’Brien & Associates (“RJO”)/RMB Group and is, or is in the nature of, a solicitation. This material is not a research report prepared by a Research Department. By accepting this communication, you agree that you are an experienced user of the futures markets, capable of making independent trading decisions, and agree that you are not, and will not, rely solely on this communication in making trading decisions.
DISTRIBUTION IN SOME JURISDICTIONS MAY BE PROHIBITED OR RESTRICTED BY LAW. PERSONS IN POSSESSION OF THIS COMMUNICATION INDIRECTLY SHOULD INFORM THEMSELVES ABOUT AND OBSERVE ANY SUCH PROHIBITION OR RESTRICTIONS. TO THE EXTENT THAT YOU HAVE RECEIVED THIS COMMUNICATION INDIRECTLY AND SOLICITATIONS ARE PROHIBITED IN YOUR JURISDICTION WITHOUT REGISTRATION, THE MARKET COMMENTARY IN THIS COMMUNICATION SHOULD NOT BE CONSIDERED A SOLICITATION.
The risk of loss in trading futures and/or options is substantial and each investor and/or trader must consider whether this is a suitable investment. Past performance, whether actual or indicated by simulated historical tests of strategies, is not indicative of future results. Trading advice is based on information taken from trades and statistical services and other sources that RJO/RMB believes are reliable. We do not guarantee that such information is accurate or complete and it should not be relied upon as such. Trading advice reflects our good faith judgment at a specific time and is subject to change without notice. There is no guarantee that the advice we give will result in profitable trades.