Silver has busted out, slicing through its 2016 high of $21.23. The poor man’s gold took out our first upside target of $19.25 per ounce on July 9. It is now within a stone’s throw of our next upside objective of $22.00. A break above $22.00 will set the stage for an assault on our next objective of $25.00 per ounce. Rising inflation expectations due to the anticipation of trillions more in financial stimulus could mean even higher silver prices sooner than most expect.
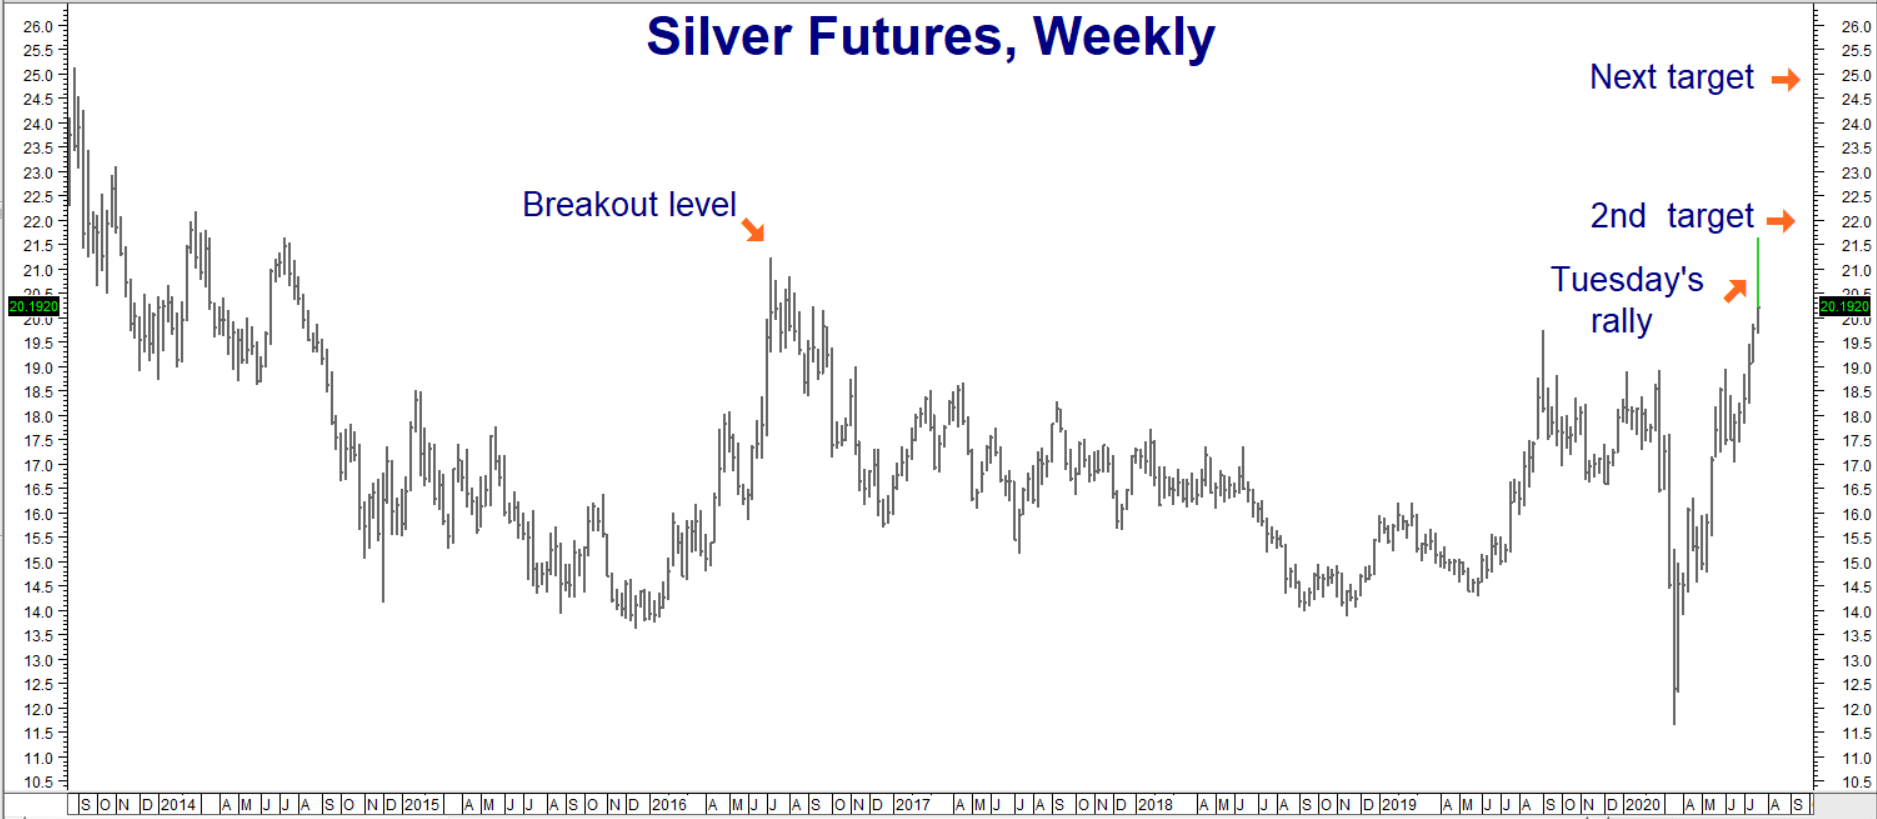
Data Source: Reuters / Datastream
Gold is a financial metal, but as we outlined in our June 9 blog post, inflation makes silver shine. Tuesday’s breakout (nominally and versus gold) may be a signal that inflation is awakening from its long slumber. Higher-than-expected stock prices may be telling us the same thing.
The chart below is from our June 9 blog post. Movement in the gold / silver ratio tends to track inflation better than gold alone. Currently trading at $21.53 per ounce, it takes 85.75 ounces of silver to buy one ounce of gold. Silver is still undervalued relative to its richer cousin, but not nearly as much as it was when it took 124 ounces of silver to buy one ounce of gold during silver’s big washout in March. Silver’s 30% gain on gold since March reflects the buildup of inflationary expectations.
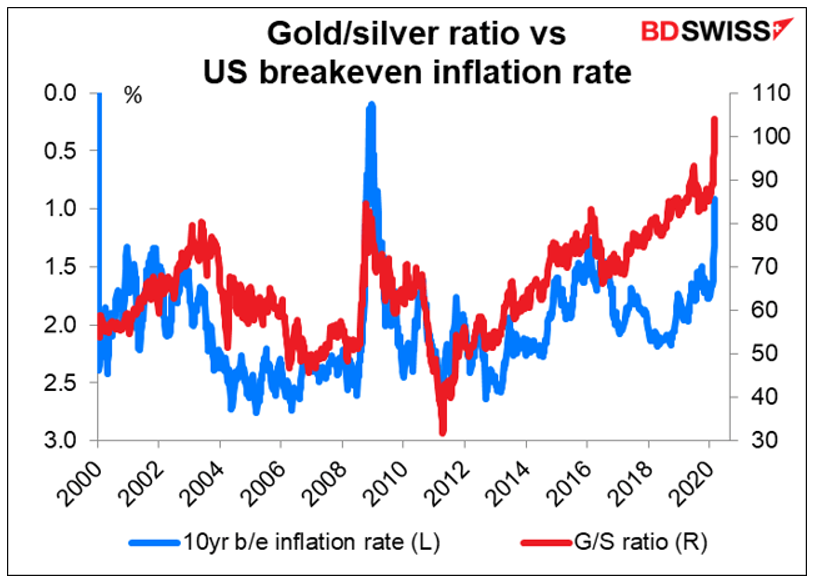
Source: BD Swiss
The gold / silver ratio spread is the red line in the chart above. The higher the ratio, the cheaper silver is vis-a-vis gold. The blue line is the 10-yr breakeven inflation rate. The inflation scale is reversed, so values at the bottom of the chart are higher than those at the top. Breakeven inflation was virtually zero at the beginning of the 2008/2009 recession. This corresponded to a gold/silver ratio of nearly 110, which meant it took that many ounces of silver to buy one ounce of gold.
The gold/silver ratio reversed in a blow-off similar to the one we just witnessed and continued to decline as inflation rose. Silver began to outperform gold until late 2011 when it took only 32 ounces of silver to buy one ounce of gold. Spot gold is currently trading for $1,870. The same ratio today would make one ounce of silver worth $55.36 without gold rising one penny more.
The chart below illustrates the history of the gold / silver ratio going back to 1985. The lower the ratio, the stronger silver is. We’ve just experienced the “Mother” of all “blow-off” highs in this ratio and yet the current ratio is still higher than all of the other tops except one. This means silver still has plenty of room to rally — on both a nominal basis and against its yellow cousin.
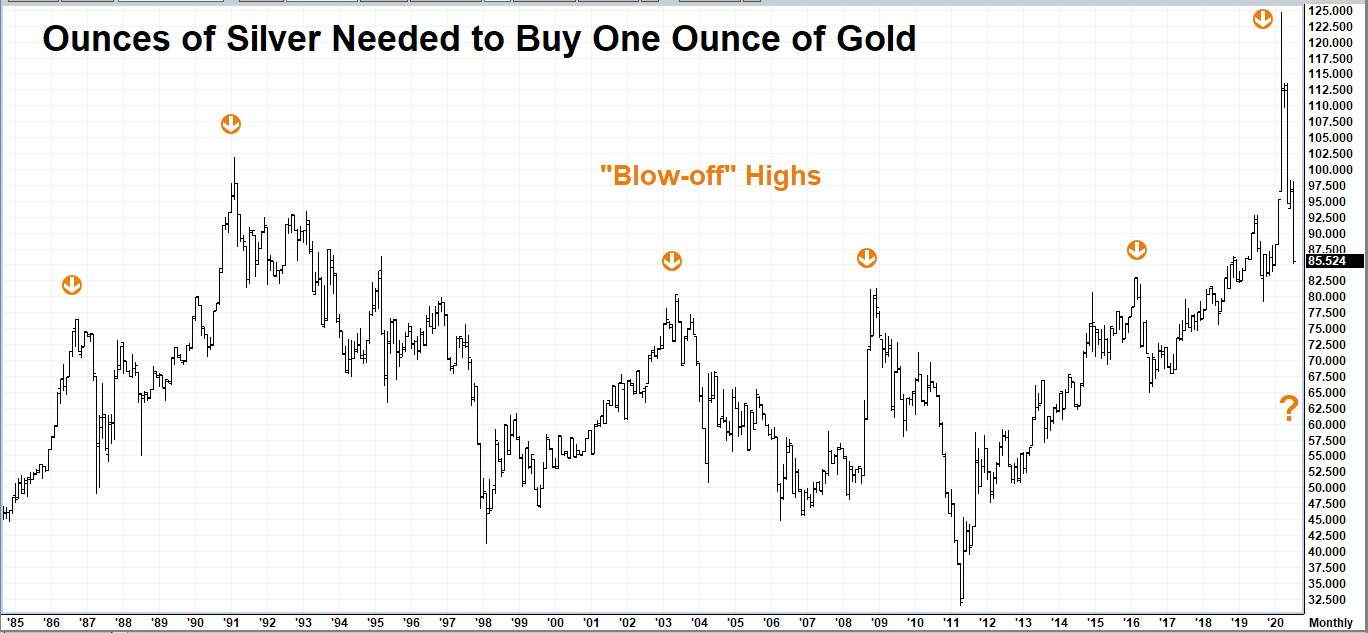
Data Source: FutureSource
What to Do Now
Silver is extremely overbought. At-the-money call options have applied volatilities of roughly 41%. They are not cheap. If you don’t have a position, consider waiting for a correction to establish one. RMB Group has been recommending long, option-based positions in silver for the past two years. RMB Group trading customers should determine their actions based on which recommendations they followed and what positions they hold. Silver is notoriously volatile at market tops and bottoms so we would not be surprised to see a sharp correction.
If the strike price of the short option of the bull spread you hold is below or just slightly above the price of the underlying futures contract, consider exiting all positions immediately and wait for a correction. Use our $25.00 target when establishing new positions. This target may change based on future price action.
Here’s a brief overview of some of our more popular silver suggestions. Please note that prices can and probably will have changed by the time you read this. Contact your RMB Group broker for the latest.
- Holders of the December 2020 $18.00 / $21.00 bull call spreads we suggested purchasing for $900 or less back in 2019 settled at $9,165 on Tuesday. Consider exiting all of your spreads now if you haven’t already. Wait for a pullback to re-enter using $25.00 per ounce as a target.
- Holders of the December 2020 $19.00 / $22.00 bull spreads recommended at prices from $2,000 to $2,500 each should consider exiting all positions. These spreads settled for $7,955 each on Tuesday. December 2020 silver futures traded as high as $21.90 on Tuesday. We consider this close enough to our $22.00 target to merit an exit.
- Holders of the December 2020 $20.00 / $23.00 bull spreads we suggested purchasing for $2,500 or less should consider exiting their positions immediately. Silver hit $23.00 per ounce in overnight trading. December $20.00 / $23.00 bull spreads settled Tuesday for $6,895. They are higher as we write this.
- Holders of the July 2021 $21.00 / $25.00 bull spreads we suggested purchasing at prices between $2,050 and $2,500 should consider exiting half of their positions immediately, taking their initial risk off the table in the process. July $21.00 / $25.00 bull spreads settled Tuesday for $6,895. Exit the other half of your positions if and when July 2021 futures contract hits $25.00 per ounce. Look to re-establish a full position following a correction.
Please be advised that you need a futures account to trade the markets in this post. The RMB Group has been helping our clientele trade futures and options since 1991. RMB Group brokers are familiar with the option strategies described in this report. Call us toll-free at 800-345-7026 or 312-373-4970 (direct) for more information and/or to open a trading account. Or visit our website at www.rmbgroup.com. Want to know more about trading futures and options? Download our FREE Report, the RMB Group “Short Course in Futures and Options.”
* * * * * * * *
The RMB Group
222 South Riverside Plaza, Suite 1200, Chicago, IL 60606
This material has been prepared by a sales or trading employee or agent of R.J. O’Brien & Associates (“RJO”)/RMB Group and is, or is in the nature of, a solicitation. This material is not a research report prepared by a Research Department. By accepting this communication, you agree that you are an experienced user of the futures markets, capable of making independent trading decisions, and agree that you are not, and will not, rely solely on this communication in making trading decisions.
DISTRIBUTION IN SOME JURISDICTIONS MAY BE PROHIBITED OR RESTRICTED BY LAW. PERSONS IN POSSESSION OF THIS COMMUNICATION INDIRECTLY SHOULD INFORM THEMSELVES ABOUT AND OBSERVE ANY SUCH PROHIBITION OR RESTRICTIONS. TO THE EXTENT THAT YOU HAVE RECEIVED THIS COMMUNICATION INDIRECTLY AND SOLICITATIONS ARE PROHIBITED IN YOUR JURISDICTION WITHOUT REGISTRATION, THE MARKET COMMENTARY IN THIS COMMUNICATION SHOULD NOT BE CONSIDERED A SOLICITATION.
The risk of loss in trading futures and/or options is substantial and each investor and/or trader must consider whether this is a suitable investment. Past performance, whether actual or indicated by simulated historical tests of strategies, is not indicative of future results. Trading advice is based on information taken from trades and statistical services and other sources that RJO/RMB believes are reliable. We do not guarantee that such information is accurate or complete and it should not be relied upon as such. Trading advice reflects our good faith judgment at a specific time and is subject to change without notice. There is no guarantee that the advice we give will result in profitable trades.