Cheap money encourages wanton financial behavior, such as borrowing for no real reason other than pure speculation. Cut-rate cash created by zero interest rates is the rocket fuel powering TINA (There Is No Alternative) trades. It leaves investors desiring a decent return no choice but to jump into the deep end of the risk pool. But could soaring 10 and 30-year bond yields signal that the era of virtually free money is coming to an end?
The huge run-up (and subsequent collapse) in GameStop (GME) was largely the result of dirt-cheap money. So are the increasingly thin-skinned bubbles in Bitcoin, Dogecoin and many well-loved NASDAQ stocks. Speculative behavior is now dominating large sectors of the market as zero interest rates enable hedge funds to play with more leverage and force John (and Jane) Q. Public to make bigger bets with their savings in order to keep pace with inflation.
How wobbly are things right now? Your humble editor was walking with his mother, trying to explain the GameStop fiasco to her, when they overheard a UPS driver returning to his truck speaking loudly to a buddy over the phone. “Don’t worry dude,” he said, “you can buy fractional shares!” When delivery drivers start making stock recommendations, it’s time for caution. But this isn’t the only threat to today’s bubble markets.
Long-Term Bond Yields Are Soaring
Federal Reserve Chairman Jerome Powell spoke yesterday, vowing to maintain the Fed’s easy money policies until three conditions are met: 1) full employment; 2) inflation rising to at least 2%; and 3) expectations that inflation would remain over 2%. We believe the passage of the Biden Administration’s plan to inject $1.9 trillion into the economy will accomplish this much faster than many expect. We are not the only ones.
The Fed may have its boot firmly pressed on the back of short-term interest rates, but it has less control over longer-term debt instruments. Bond traders are selling, sending the prices of 10 and 30-year Treasuries lower and their corresponding yields higher. The yield on 10-year T-notes finished yesterday at 1.36% — 36% higher than the low in August. 30-year T bonds yielded 2.18% — a whopping 45% higher than their August low.
Chairman Powell may have downplayed the Fed’s concern with inflation yesterday, but the professionals who dominate bond trading appear to be doing the opposite. Bond yields don’t rise unless traders believe in a stronger, more inflationary future, a chance of default or a combination of both. With default highly unlikely – at least not yet – the signal coming from the bond market is fairly obvious.
10-Year T-note Yield
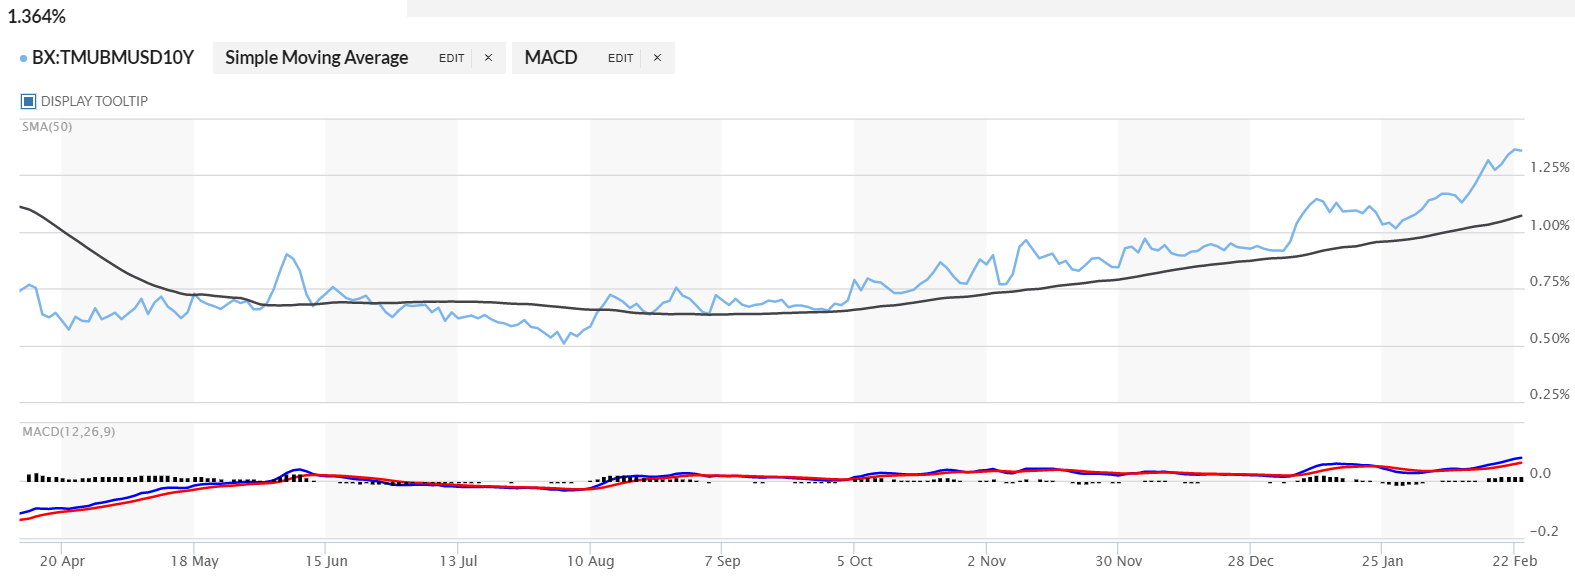
Source: MarketWatch
30-Year T-Bond Yield
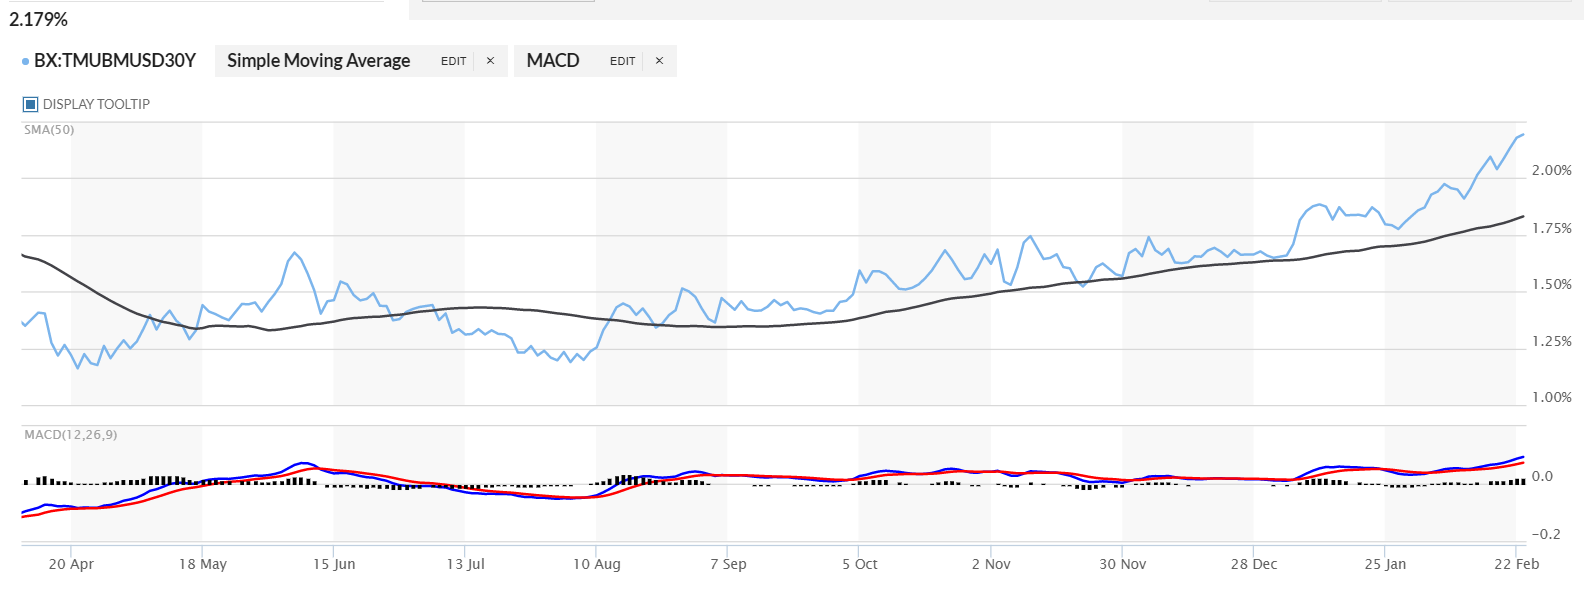
Source: MarketWatch
Economy Is Awash in Money
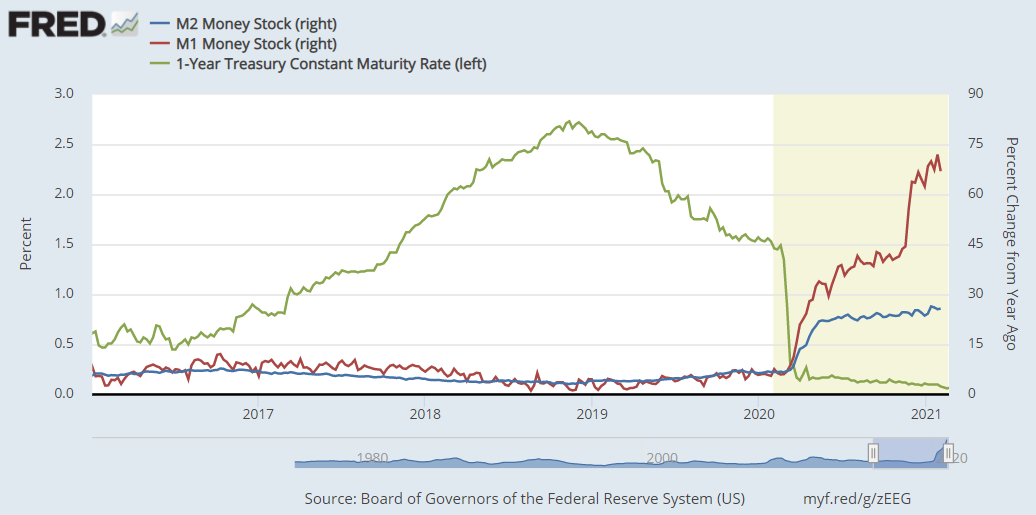
One of the biggest things spooking the bond market right now is exploding money supply. Two classic money supply metrics, M1 and M2, are through the roof. M2 (the broader of the two) is up 26% in the short time since the end of 2020. M1 is up an incredible 70%. Much of this is due to the trillions of both Fiscal and Monetary stimuli pumped into the American economy to date. The chart below illustrates how fast both of these measures have ballooned since the nation closed the book on 2020.
Once sure-fire leading indicators of impending inflation, both of these measures have fallen out of favor since the turn of the century. This is when the Fed began mitigating market crashes by artificially suppressing interest rates. The red line on the chart below is inflation. The black line is M2. Note how inflation almost always showed up after spikes in M2 – until the 2001 “Dot-Com” crash. It has still appeared since then, but in a more subdued way that made analysts pay less attention.
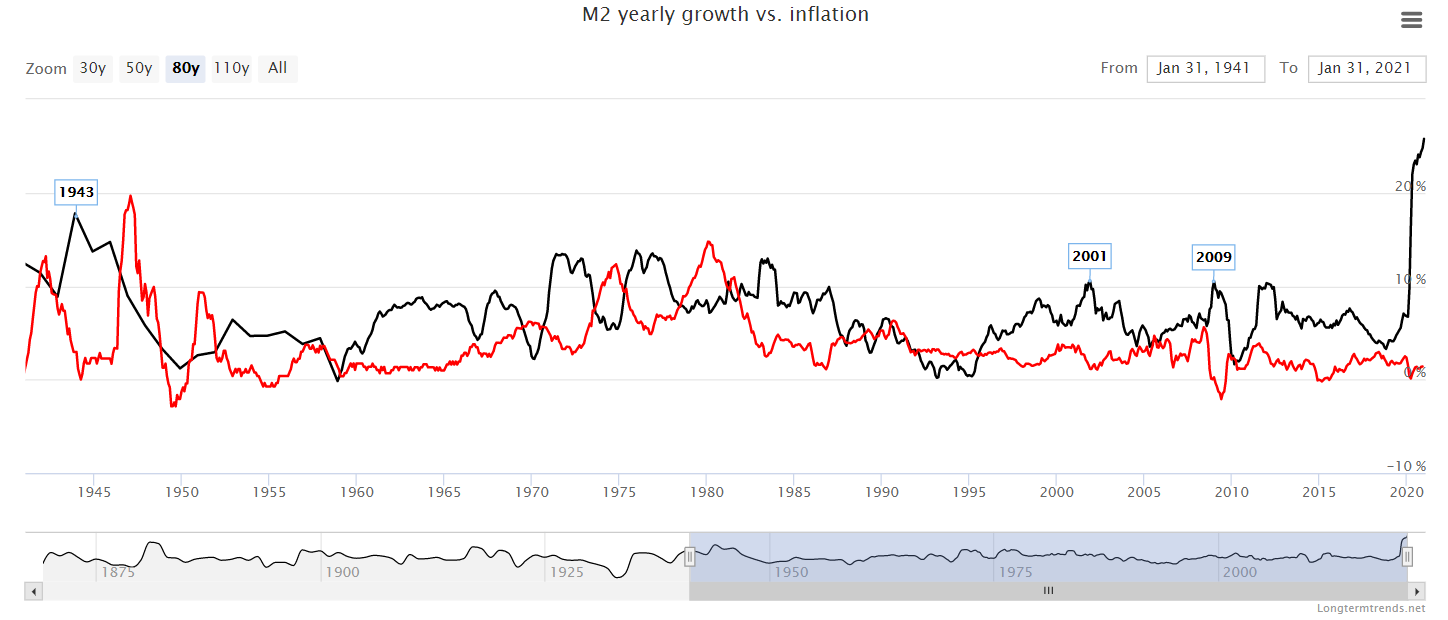
Source: Longtermtrends.com
That inflation didn’t soar after the past two recessions reduced and, in many cases eliminated, the predictive value of spikes in money supply in the minds of many. In fact, some find it virtually worthless as an indicator. But inflation did soar after 2001, if not on a nominal, then on a relative basis. This was, and still is ignored.
As the chart above illustrates, a 10% increase in M2 in 2001 (when inflation was close to zero) eventually resulted in an inflation rate of 5% four years later. A nearly identical increase in M2 following the 2009 housing crash (when inflation was negative) led to an increase in inflation 3 years later. The last time M2 came anywhere close to spiking nearly as high as the 26% of the past two months was in 1943 during WW II. Double-digit inflation followed.
Expect History to Rhyme
We are not expecting history to repeat. However, given the classic definition of inflation as “Too much money chasing too few goods,” we do expect it to rhyme. If today’s 26% M2 spike has only half the effect that the 2001 and 2009 spikes did, post-pandemic inflation is nowhere close to being discounted by the market. No wonder professional bond traders have been happily fighting the Fed.
We were not surprised by rising bond yields and falling bond prices, and were fortunate enough to have been positioned on the right side of this move. (We wrote about it in our blog post of December 10, 2020.) However, yields have risen and prices have fallen fast enough to make it difficult to construct a reasonable, fixed-risk way to play this market now that our March 2021 T-note puts are off the board.
Instead, we’ve decided to take a relative interest rate approach to the foreign currency market. FX has not experienced the high volatility exhibited by nearly every other asset class. Consequently, we believe its options are far more reasonably priced.
US Dollar’s Relative Rate Advantage Growing
There has been a lot of talk about how the COVID-19 economy favors a weak dollar. Much of it revolves around relative interest rates. Federal Reserve bond buying (otherwise known as quantitative easing or “QE”) was expected to suppress the yields of American bonds vis-à-vis those of other large nations. This would cause investors to shift funds away from the US and make the currencies of foreign nations more attractive as money flowed out of the US into greener pastures. As the Euro chart below suggests, this is pretty much what happened.
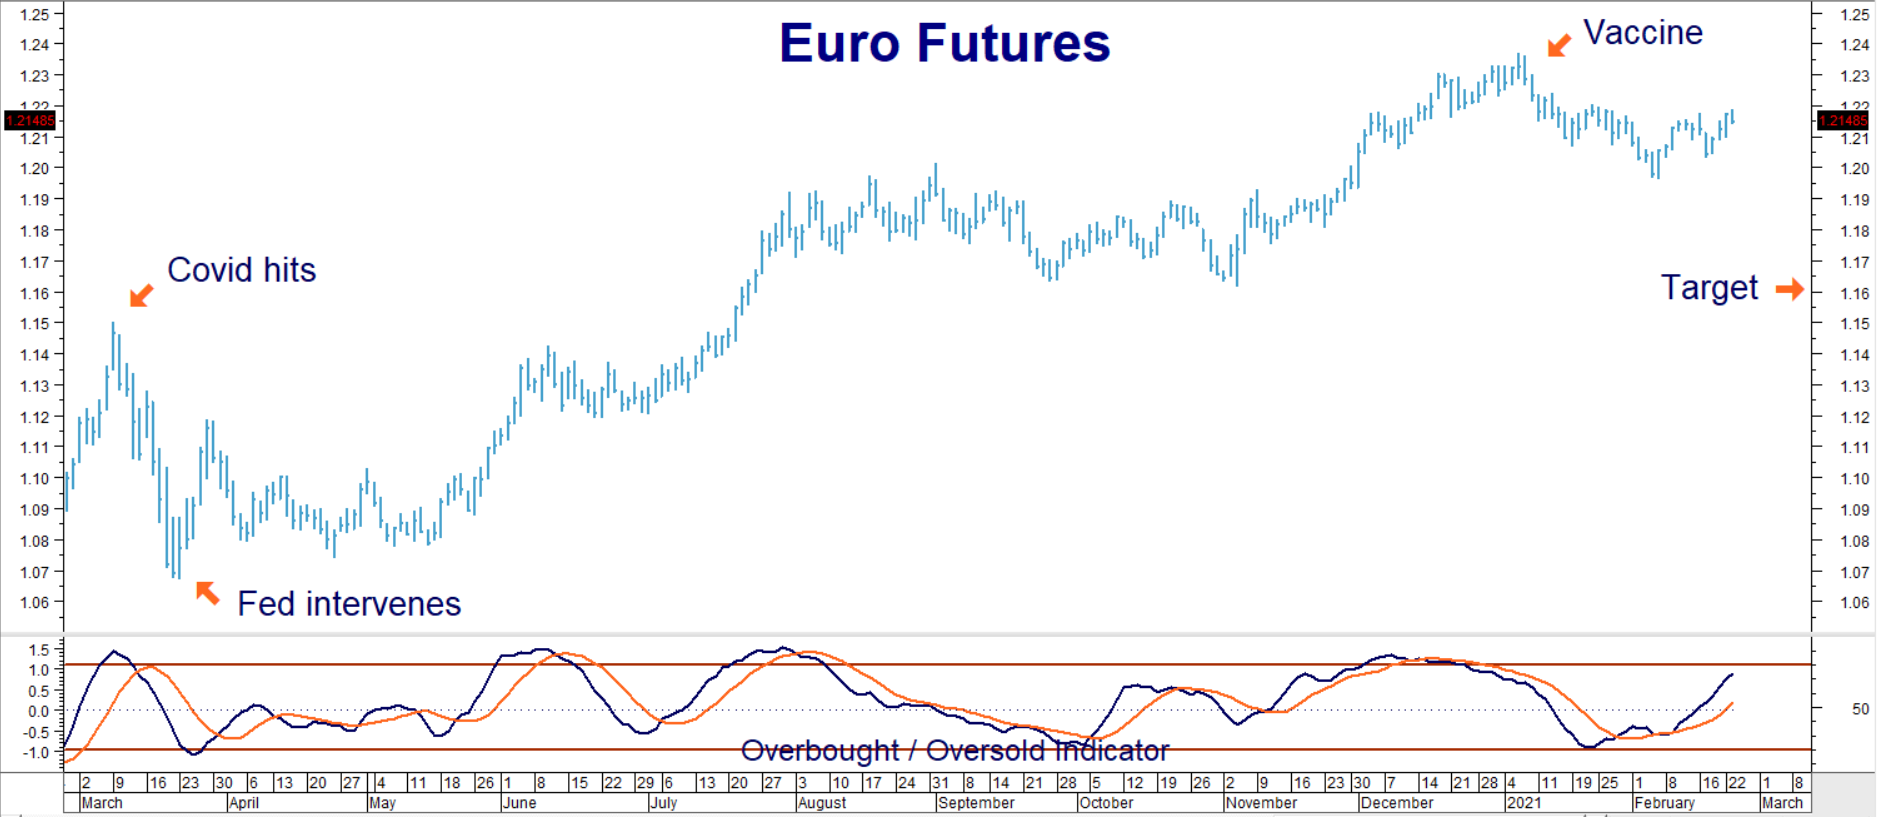
Data Source: Reuters/Datastream
We will use a short euro strategy as a reverse proxy for a long dollar position for three reasons: 1) Euro futures and options are far more liquid than US Dollar Index futures and options, making them easier to trade; 2) the Euro area is severely lagging the US in terms of recovery and; 3) eurozone bond yields are slipping further versus their American alternates.
The yield of the US 10-year Treasury is soaring again this morning as its price falls. At 1.40%, it is higher than all large eurozone nations. 10-year Bund yields in Germany are still negative, yielding -0.32%. France’s 10-year is also negative, yielding minus 0.07%. Spanish bonds log in at 0.41% and profligate Italy’s bonds are paying 0.70% — just half of US Treasuries.
Why has the Euro gained on the US dollar? We believe it has to do with the Fed’s initial response to the pandemic and America’s patchwork medical response to the same – at least that is what the chart above suggests. The euro sold off hard (and the dollar rallied) when COVID first hit due to flight-to-quality dollar buying.
US Treasury yields soared as investors sold everything they could – including bonds. The Fed stepped in and backstopped all asset classes. This caused US Treasury yields to fall rapidly, taking the dollar down (and the Euro up) with them. Relative interest rates which had favored the Greenback, favored them less so. At the same time, the US was not handling its outbreak very well. This triggered a lack of confidence. Money flowed out of dollars and into Euros.
The development of vaccines appears to have changed the game. The US is not only making more progress against the pandemic than Europe, its bond market is offering a huge relative return premium. Best of all, Euro futures have remained relatively quiet, enabling investors to take a reasonable, fixed-risk bearish position using put options. The Euro is overbought making it vulnerable to further declines.
What to Do Now
RMB Group trading customers may want to consider purchasing the June 2021 $1.19 Euro puts traded on the CME. These are currently trading for $750 each. Your maximum risk is the amount paid for your puts plus any transaction costs. These puts will be worth at least $3,750 should June Euro futures hit out $1.16 downside objective prior to option expiration on June 4, 2021. Prices can and will change, so contact your RMB Group professional for the latest.
Please be advised that you need a futures account to trade the markets in this post. The RMB Group has been helping our clientele trade futures and options since 1991. RMB Group brokers are familiar with the option strategies described in this report. Call us toll-free at 800-345-7026 or 312-373-4970 (direct) for more information and/or to open a trading account. Or visit our website at www.rmbgroup.com. Want to know more about trading futures and options? Download our FREE Report, the RMB Group “Short Course in Futures and Options.”
* * * * * * * *
The RMB Group
222 South Riverside Plaza, Suite 1200, Chicago, IL 60606
This material has been prepared by a sales or trading employee or agent of R.J. O’Brien & Associates (“RJO”)/RMB Group and is, or is in the nature of, a solicitation. This material is not a research report prepared by a Research Department. By accepting this communication, you agree that you are an experienced user of the futures markets, capable of making independent trading decisions, and agree that you are not, and will not, rely solely on this communication in making trading decisions.
DISTRIBUTION IN SOME JURISDICTIONS MAY BE PROHIBITED OR RESTRICTED BY LAW. PERSONS IN POSSESSION OF THIS COMMUNICATION INDIRECTLY SHOULD INFORM THEMSELVES ABOUT AND OBSERVE ANY SUCH PROHIBITION OR RESTRICTIONS. TO THE EXTENT THAT YOU HAVE RECEIVED THIS COMMUNICATION INDIRECTLY AND SOLICITATIONS ARE PROHIBITED IN YOUR JURISDICTION WITHOUT REGISTRATION, THE MARKET COMMENTARY IN THIS COMMUNICATION SHOULD NOT BE CONSIDERED A SOLICITATION.
The risk of loss in trading futures and/or options is substantial and each investor and/or trader must consider whether this is a suitable investment. Past performance, whether actual or indicated by simulated historical tests of strategies, is not indicative of future results. Trading advice is based on information taken from trades and statistical services and other sources that RJO/RMB believes are reliable. We do not guarantee that such information is accurate or complete and it should not be relied upon as such. Trading advice reflects our good faith judgment at a specific time and is subject to change without notice. There is no guarantee that the advice we give will result in profitable trades.