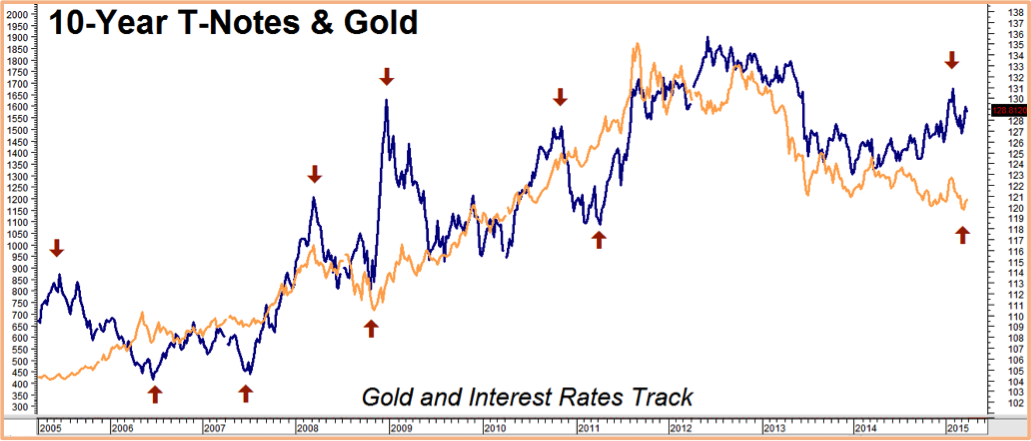
The chart below compares the price of 10-Year US Treasury Notes with the price of gold over the past decade. We consider the relationship of these two markets to be not only one of the most important but also one of the most tradable spreads of the year. Bond investors know rising T-note prices represent falling long-term interest rates.
Gold tends to do better in a low interest rate environment because holding it when interest rates are low requires investors to give up less. This makes sense. Gold doesn’t provide an income stream. It is a lot more attractive when supposedly “safe” returns on government bonds and notes are miniscule. Given today’s paltry yields, we are surprised the yellow metal is not doing better.
Negative interest rates in Europe and yields of nearly zero in Japan have lowered the opportunity cost of holding gold to virtually nothing in two of the biggest economic zones in the world. The current divergence in this market is telling us that either 1) the price of gold is too low, 2) global bond yields are too low (making current prices too high), or 3) both.
 Data Source: Reuters/Datastream
This is not the first time the prices of gold and T-notes have diverged. The red arrows on the chart (above) show other instances going back to 2005. In each case, these divergences were followed in relatively short order by a sharp convergence in price achieved mostly by a reversal in the price of T-notes. The current divergence is the second biggest of the decade, eclipsed only by the one caused by the Lehman collapse in late 2008 – early 2009. We do not expect it to last much longer.
We cannot be sure how prices will converge (gold up, bonds down or both), so our approach has been to combine fixed-risk short positions in bonds with fixed-risk long positions in gold, looking to gain an advantage if and when these markets move back in synch. We are still holding our long June bull spreads in gold and we’ll probably have more on the Midas metal next week. Today we want to focus on bonds.
We originally recommended a bearish position in bonds in Alert #4 (click here to read) and then suggested taking some cash of the table in mid-February’s Alert #6 (click here to read) in response to an oversold condition in bonds. The recent rally in T-notes and bonds has provided us with an opportunity to re-establish our full short position.
 Data Source: Reuters/Datastream
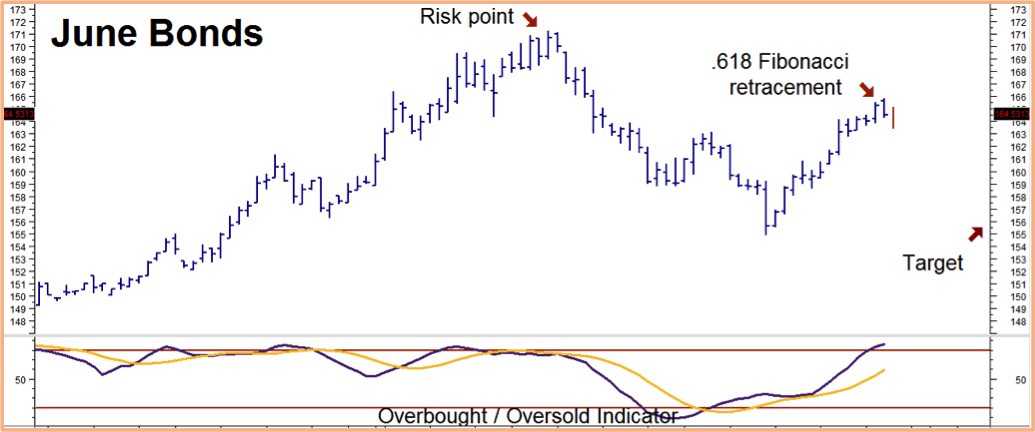
US T-Bond futures are now overbought – reversing the oversold condition that signaled our partial exit in February – and have retraced a Fibonacci perfect .618% of their latest down move. Today’s price action (in red on the chart above) has taken out the lows of the past two days, severely damaging upward momentum and setting the stage for a retest of support at 155-00 in the June contract.
What To Do Now
Let’s see if we can re-establish a full short position in this market by re-entering June bear put spreads similar to those we exited when bonds were oversold in February. The spreads we are looking at are going for roughly $844 plus transaction cost. This is our total risk on the trade. They have the potential to be worth as much as $4,000 should our 155-00 target be hit on or prior to option expiration on May 22, 2015. We’ll use two consecutively higher closes over old highs of 171-00 as our risk point.
Prices can and do change so check with your personal RMB Group broker for the latest on this or alternative protective strategies and to get up-to-the-minute pricing and advice. If you don’t have an RMB Group trading account and would like to know more about this or any other “Big Move” strategy, call 800-345-7026 toll free or 312-373-4970 direct. You can also email suerutsen@rmbgroup.com or visit us online at www.rmbgroup.com.