Simpler is often better when discussing topics like fractional reserve banking, so let’s keep it simple. Investors put money into a bank. If it is a savings account or a CD, the bank pays those investors interest in exchange for the use of that money. Most checking accounts receive no interest. The bank gets to use that money for absolutely no cost. The bank then takes the cash it receives as deposits and lends it out at a higher rate, making a profit on the difference between the interest rate it pays its depositors and the interest rate it charges for loans.
Banks are required to hold on to only a fraction of the money they have on deposit to satisfy customer withdrawals, hence the name “fractional reserve banking system.” (We’ll have more to say about this in future blogs.) The amount banks are required to have on deposit is known as the “reserve requirement.” Banks must maintain this amount in cash.
This system works extremely well most of the time. Depositors get a relatively safe return and liquid access to their money. The bank makes credit available which individuals and businesses can use to purchase homes, expand their operations, or do anything else they deem economically worthwhile. It is expected that this activity will generate enough of a return to pay the bank back with interest and generate a profit for the borrower.
This process, albeit dramatically simplified, is what underpins the entire modern economic system. It works great during periods of economic growth. It stops working when growth stalls or goes into reverse, such as in a recession. The need for constant growth to service debt is responsible for the dynamism of the modern economy; it forces businesses and individuals to keep innovating. But it is also the system’s “Achilles Heel.” Things go to hell in a handbasket without it.
Debt Drives the Business Cycle
More debt requires more growth, which requires more debt, which requires even more growth – ad infinitum – until the process is halted violently either through inflation, which cheapens the real value of money and the buying power of everyone, or through default, which cheapens the prices of assets.
This push and pull of debt is ultimately responsible for the business cycle. Things get out of whack. There is a crisis. Equilibrium is restored (after much financial pain of course) until the next crisis starts the cycle all over. The business cycle is part of the financial system we live by. It is self-correcting. There is no repealing it. Too much money in the system ultimately results in price inflation, asset inflation or some other economic dislocation.
Problems arise when governments and central banks try to “fine tune” the business cycle to meet political objectives. Attempts to circumvent it through artificial means may work over the short run, but nearly always make the next crisis worse. The Fed’s attempt to soften the dot-com Crash of the early 2000s created the disruptive asset inflation that led to the global financial crisis of 2008. Now asset inflation is back and more dangerous than ever.
We believe the Fed’s recent attempt to offset the deflationary impacts of President Trump’s trade war with China by reducing interest rates (while the stock market is in the midst of the longest bull market in recorded history) is a mistake. The Fed is setting the stage for a far more punishing crisis ahead, with few places to hide. We do not expect bonds to provide the protection investors are counting on. They could fall harder than stocks.
Cheap Money and Exploding Debt – A Toxic Mix
The global financial crisis of 2008 was caused by an excess of non-productive debt used to finance speculative asset plays. Mom and Pop investors with no experience in real estate were able to get loans to purchase houses and apartments in an overpriced market. Many took out those loans convinced that housing prices would always go higher. They expected to be able to sell at a price high enough to cover the interest on their loans and make a hefty profit besides. Artificially low interest rates, courtesy of the Fed, made this possible. We all know how that turned out.
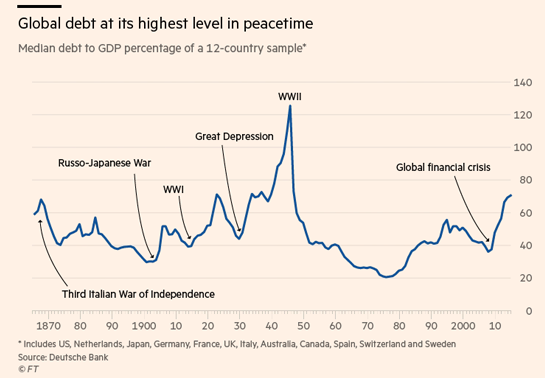
We included the chart above in our last blog post. It’s worth showing again because debt – especially non-productive debt – generally has a leading role in all financial crises. The target this time is not the house, but debt itself. Like the Mom and Pop house-flippers of 2007, today’s debt market players believe bond prices are destined to go higher as interest rates head lower. How do we know this? Negative interest rates.
Money is now so cheap that big players are falling all over themselves trying to put it to work. They are purchasing bonds with negative interest rates, which means these bond buyers (lenders) are essentially paying borrowers to take their money. The only way this makes sense is if bond buyers believe rates could get even more negative. They are making a huge bet that the prices of their bonds will keep going up.
(Note: Bond prices move opposite interest rates. The price of a bond with an interest rate of negative 50 basis points will be worth more than the price of a bond with a rate of negative 25 basis points.)
Bond prices, like house prices, will eventually stop going up. Interest rates will eventually stop falling. Once this happens, the best the holder of negative-rate debt can do is lose. Interest rates don’t need to go up to begin this process; they just need to stop going down. As we write this, over $17 trillion of the $100 trillion global bond market has negative interest rates. Add in shorter-term debt instruments and over $20 trillion (or nearly ¼) of the global debt market pays negative interest rates. (See dark blue portion of the chart below.)
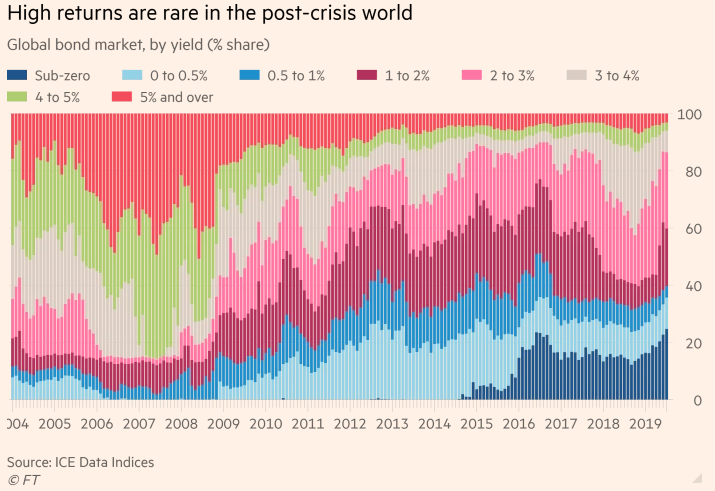
Imagine what will happen when the holders of nearly $20 trillion in negative-yielding debt try to get out of the same door at the same time as they scramble to sell.
Negative Rates Are a Symptom of Economic Rot
Interest rates measure the price of money. Negative rates mean money is now cheaper than it has ever been. The problem is all this new cash is available only to those who do not need it. Billionaire investor Ray Dalio had a lot to say about this, as well as other negative ramifications of overly cheap money, in his blog post “The World Has Gone Mad and the System Is Broken”. We linked this in last week’s blog. If you haven’t read it, you should.
Little of the new money printed over the past 11 years has made its way into the pockets of the middle and lower classes. The Fed and other central banks are doing the best they can, but their only method of injecting capital is through the global banking system. This means it must flow through financial centers where it is used not for economic growth, but to buy (or buy-back) stocks or bonds. This is why financial asset prices are soaring.
We believe this trend of higher asset prices will eventually meet its end, whether through another economic crisis, global political dislocations or both. Expect the coming reckoning to be even more disruptive than the financial crisis of 2008, much like that crisis in relation to the dot-com crash of 2001. There is simply not enough global growth to prevent it.
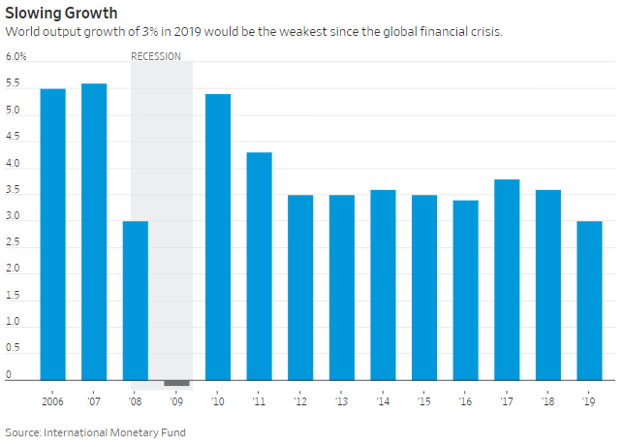
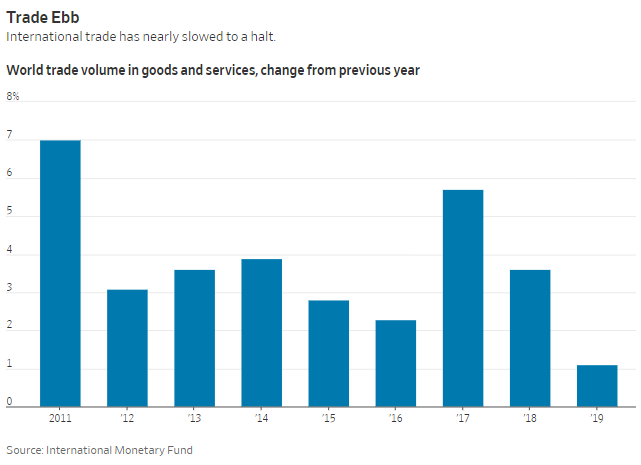
The two charts above paint a disturbing picture. Like it or not, the fractional reserve banking system requires constant economic growth to work properly. The more debt in the system, the more growth is needed to cover it. This growth is not happening.
As we mentioned earlier, the business cycle cannot be repealed. Delaying the inevitable will only make the inevitable worse. This is why we believe the Fed’s last three interest rate reductions will go down in history as one of its biggest mistakes. The problem isn’t enough money, it’s where the money is going. Over $20 trillion in capital can’t find a better place to settle than in negatively-yielding debt — guaranteed from the start to lose. We believe this is a symptom of rot in the global economy that central banks simply cannot fix.
Time for Caution in Bonds
While an abundance of caution currently reigns in the stock market despite a series of new highs, bonds are another matter. It’s hard to find anyone who doesn’t think interest rates are going to remain low and even head lower. There has even been talk the US will follow Europe down the dark path of negative interest rates.
But lower rates are not working the way they have in the past. They may be helping to elevate stock prices by forcing capital from the relative safety of short-term instruments like CDs into riskier dividend-paying stocks, but they are doing virtually nothing to help global growth. Without growth, debt levels keep rising as new debt is issued to pay off old debt. This has the potential to turn today’s growth problem into tomorrow’s solvency problem.
With nearly $25 trillion of negative-yielding debt waiting to be sold, the bond market could be even more vulnerable to a potential melt-down than the stock market. At $100 trillion plus, the global bond market is over twice as large as the global stock market. This could make a steep sell-off in bonds far more destructive than a similar decline in stocks.
10-Year Treasuries Display Weakness
A sustained bear market in bonds may be not be upon us yet, but 10-year US Treasury note futures are showing signs of topping. Last week’s close below the 12-month uptrend line was this market’s first real sign of weakness since the rally began last October. Prices also took out a previous low for the first time in a year. October’s new high close for the move at 132-03 lasted just one short weekend, exhibiting all the signs of a classic “bull trap.”
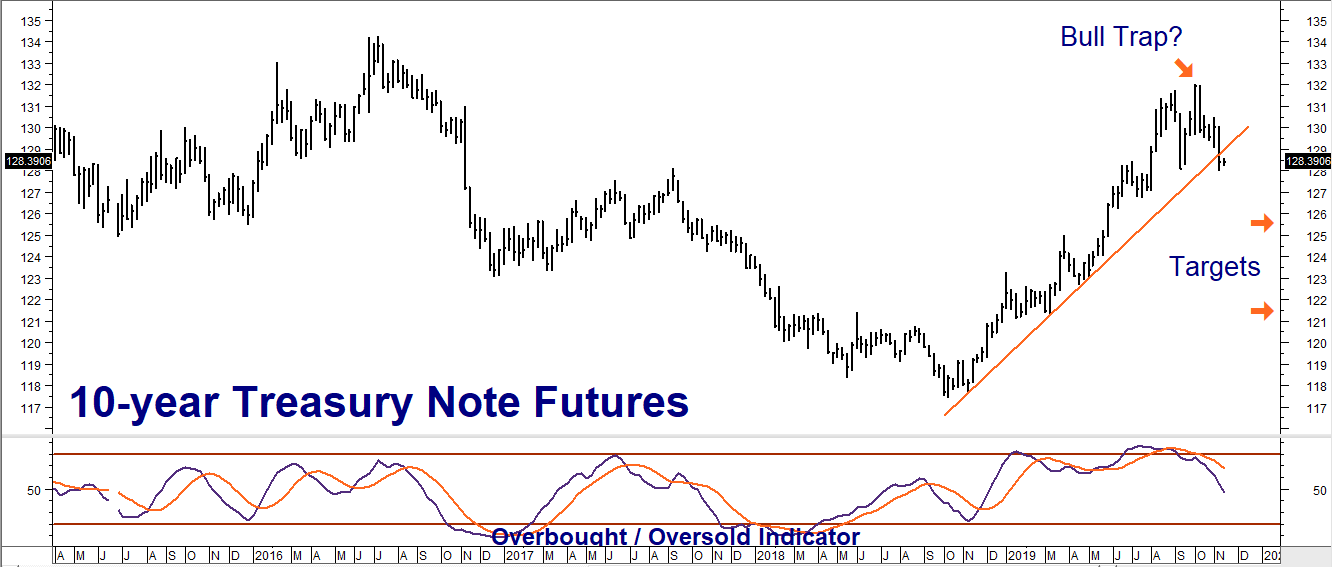
The chart above suggests 10-year Treasuries could be setting up for a move lower. Our downside targets are 125-32 and 121-32 respectively. RMB trading customers who want to capitalize on such a move, or hedge interest-rate exposure in their portfolios, may want to consider purchasing March CBOT 127-00 10-year Treasury puts. Pay no more than $500 each. This is $125 less than the current price of $625. Hedgers should consider buying one put for every $200,000 of bond exposure in their portfolios.
March 127-00 10-year T-note puts will be worth at least $1,500 each should March 10-year Treasury futures hit our first objective at 125-32 prior to option expiration on February 21, 2020. Add $1,000 for each full point drop below that. A move down to our second objective at 121-32 would make them worth $6,500 each. Your maximum risk is the amount you pay for your puts plus transaction costs.
Please be advised that you need a futures account to trade the markets in this post. The RMB Group has been helping its clientele trade futures and options since 1991. RMB Group brokers are familiar with the option strategies described in this report. Call us toll-free at 800-345-7026 or 312-373-4970 (direct) for more information and/or to open a trading account. Or visit our website at www.rmbgroup.com. Want to know more about trading futures and options? Download our FREE Report, the RMB Group “Short Course in Futures and Options.”
* * * * * * * *
The RMB Group
222 South Riverside Plaza, Suite 1200, Chicago, IL 60606
This material has been prepared by a sales or trading employee or agent of R.J. O’Brien & Associates (“RJO”)/RMB Group and is, or is in the nature of, a solicitation. This material is not a research report prepared by a Research Department. By accepting this communication, you agree that you are an experienced user of the futures markets, capable of making independent trading decisions, and agree that you are not, and will not, rely solely on this communication in making trading decisions.
DISTRIBUTION IN SOME JURISDICTIONS MAY BE PROHIBITED OR RESTRICTED BY LAW. PERSONS IN POSSESSION OF THIS COMMUNICATION INDIRECTLY SHOULD INFORM THEMSELVES ABOUT AND OBSERVE ANY SUCH PROHIBITION OR RESTRICTIONS. TO THE EXTENT THAT YOU HAVE RECEIVED THIS COMMUNICATION INDIRECTLY AND SOLICITATIONS ARE PROHIBITED IN YOUR JURISDICTION WITHOUT REGISTRATION, THE MARKET COMMENTARY IN THIS COMMUNICATION SHOULD NOT BE CONSIDERED A SOLICITATION.
The risk of loss in trading futures and/or options is substantial and each investor and/or trader must consider whether this is a suitable investment. Past performance, whether actual or indicated by simulated historical tests of strategies, is not indicative of future results. Trading advice is based on information taken from trades and statistical services and other sources that RJO/RMB believes are reliable. We do not guarantee that such information is accurate or complete and it should not be relied upon as such. Trading advice reflects our good faith judgment at a specific time and is subject to change without notice. There is no guarantee that the advice we give will result in profitable trades.