The New Year brings hope that those unmet goals will, with the right amount of effort and planning, become reality. The New Year also brings a flood of prognosticators who have dusted off their crystal balls in the hope of gaining an edge on the future. We will not do that.
In our early December blog post we quoted baseball great, Yogi Berra, who famously said, “You can observe a lot just by watching.” What we observed then led us to conclude that “the very best one can say about stocks…is that they are in a volatile, sideways market with a downside bias.” This helped prepare us for the volatility that defined the rest of December in stock indexes. While trades and investments are bets on an unknowable future, simple observations in the present can provide critical guideposts.
Here are three we are watching now:
Observation 1: Stocks Are Oversold But Still In a Bear Market
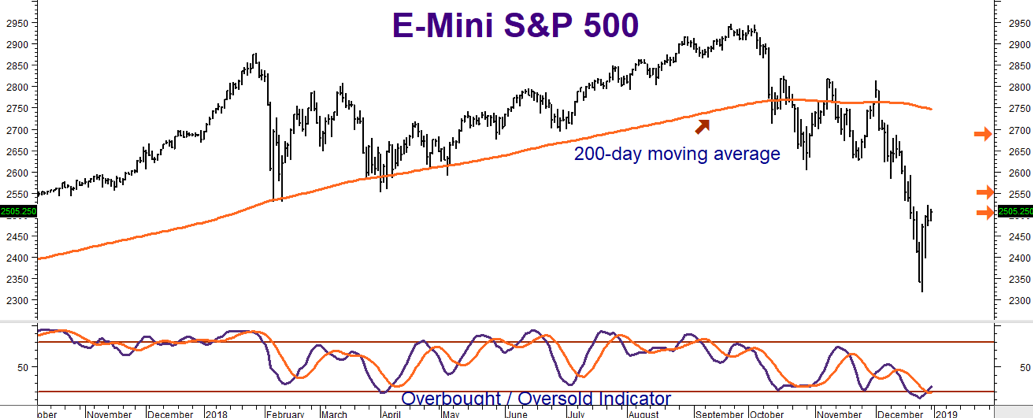
Sounds obvious, doesn’t it? But the price action of the S&P 500 gave us plenty of indications that December’s violent moves to the downside were not only possible, but likely. The key was the 200-day moving average. When we wrote our blog post, the S&P 500 was oscillating on either side of this average. The fact that the 200-day MA had been violated to the downside so often meant the bull market was over. December’s big break below it was confirmation that the bear has awoken.
Bear markets act differently than bull markets. Bull markets climb slowly up a “wall of worry” with investors using bad news as buying opportunities. Bear markets slide quickly down a “slope of hope” as investors use good news to get out while the getting is still good. Fear is a much more powerful emotion than greed, so while bull markets “take the stairs up,” bear markets “take the elevator down,” erasing months – and sometimes years – of gains very quickly.
December is usually an “up” month for stocks, but not this year. December 2018 will go down as the worst in modern history, despite the biggest one-day rally ever recorded in the Dow Jones Index. Huge short-covering rallies are another characteristic of bear markets. Given how oversold this bear market was in December, we expect to see more in 2019. We do not believe these rallies should be chased.
Data Source: Reuters
The proper way to trade a bull market is to “buy the dip.” Conversely, the proper way to trade a bear market is to “sell the rip.” These trader clichés say the same thing: the trend must be respected. Right now, the trend is solidly down as the chart above illustrates.
The orange arrows show resistance levels that this oversold market could reach without negating its bear market characteristics. We are testing the first one (roughly 2505 in the E-mini futures) now. This represents a 50% retracement of the last down-leg. Failure to rally from here probably means a retest of December’s lows.
The other two worth watching are 2550 (a 61.8% retracement of the last down-leg) and 2690 (a full retracement). Bear markets usually take months, and sometime years, to resolve. We could still be in the early innings for this one. It will take a number of decisive closes back above the 200-day moving average to end it.
Observation #2: The Dollar Bull Is Sleeping
Short-term European interest rates have been effectively set at zero for quite some time while the Fed has been busy raising rates from a low of 25 basis points (or 0.25%) to the current rate of 2.5%. Not surprisingly, money flowed westward across the Atlantic in search of these higher yields. Given the huge differential in these relatively risk-free rates of return, one would expect a roaring bull market in the greenback. But, as we’ve noted in past blogs, this hasn’t been the case.
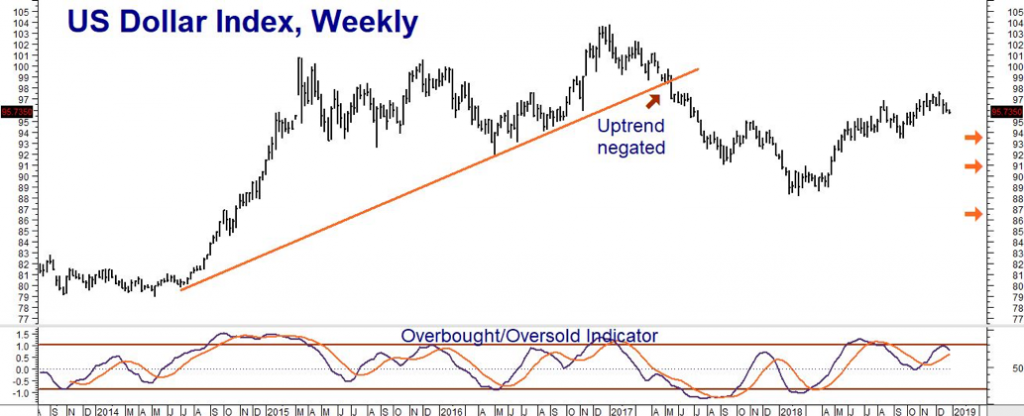
The dollar has been sleeping. As the chart below illustrates, the big bull market in the dollar effectively ended almost two years ago. The past two years have been marked by a series of smaller, cyclical bear and bull markets that have traced out a big trading range. When markets ignore good news – a yield advantage of 2.5% is certainly good news – they are often pricing in expectations of bad news down the road. We believe this is the case with the dollar.
The European Central Bank (ECB) recently announced an end to their Quantitative Easing policy which means higher short-term rates may not be far behind. At the same time, the burgeoning bear market in US stocks is putting the brakes on the Fed’s tightening agenda, causing the Fed to reduce the number of rate hikes expected in 2019. The Fed could reduce them further should the S&P continue to tank – possibly eliminating them altogether.
 Data Source: Reuters
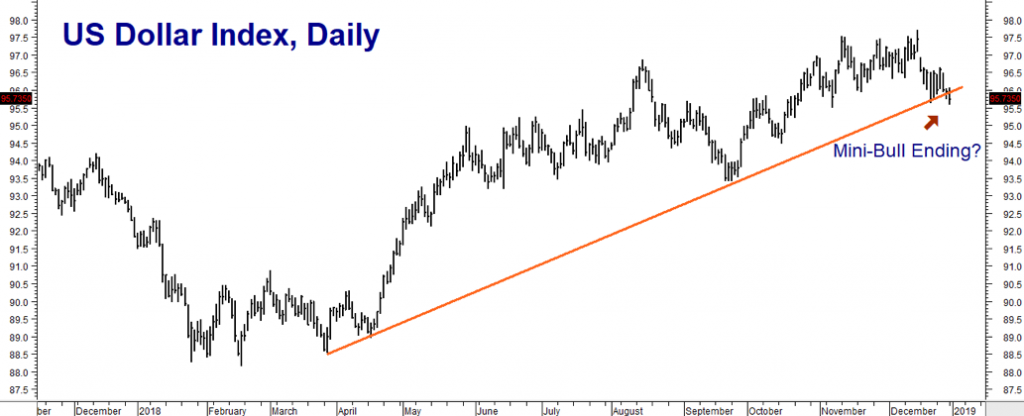
A few more closes below current levels could disrupt the mini-bull (see chart below) underway right now, sending the buck back down into the eighties in relatively short order. The orange arrows on the chart above show potential downside targets if the current uptrend is negated. The red arrow on the chart below shows how close we are to either confirming or negating the mini-bull market currently in force. The market will give us an answer soon, either way.
 Data Source: Reuters
RMB Group trading customers may want to consider bearish strategies in the US Dollar Index and/or bullish strategies in the Euro should we get a confirmed downside negation of the current bull market. Euro options tend to be much more liquid than dollar index options, making a bullish Euro play easier to create. Check with your personal broker for the latest.
Observation #3: Something Is Stirring in Gold and Silver
Gold and silver have been “dead” money for quite some time. Neither earns a return and both cost money to store and insure – money which could be used to generate returns somewhere else. Because the decision to buy gold and silver is generally not made in a vacuum, the Fed’s recent tightening has not been particularly friendly to precious metals. Why buy metal when you can get 2.81% (Bankrate.com) on a one-year FDIC-insured CD which safely keeps pace with the rate of inflation?
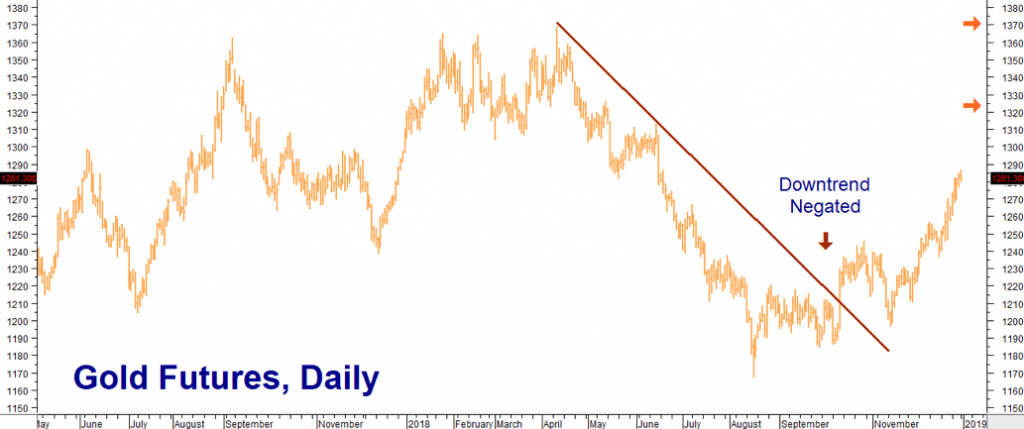
But things are beginning to look up for gold and silver. While both markets remain in multi-year, wide-swinging trading ranges, they’ve started to make noise to the upside. Gold negated its 2018 downtrend in late September, just as the stock market began to swoon. Gold tends to decline with stocks as gold investors liquidate to meet margin calls in their stock accounts. But not this time. Gold is rallying as stocks decline.
The orange arrows on the chart below show the next resistance levels for this baby bull which could be used as short-term upside objectives. Gold is a bit overbought, so we wouldn’t be surprised to see a bit of downward corrective action first.
 Data Source: Reuters
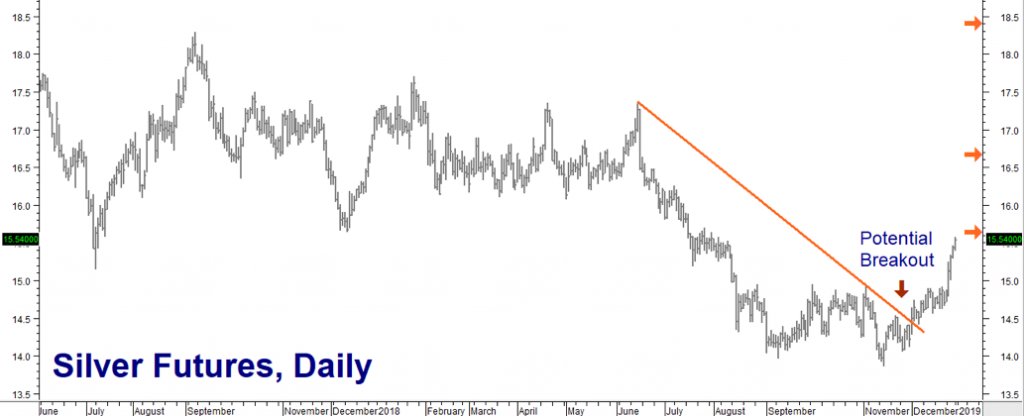
The action is similar in silver. We wrote about silver in our last blog of 2018. Silver tends to outperform gold in bull markets and underperform gold in bear markets. It currently takes about 82.47 ounces of silver to buy one ounce of gold, which is about as cheap in relation to gold as we’ve ever seen. While this doesn’t necessarily mean the beginning of a new bull market, silver would be the logical choice should one be inclined to bet on a new bull market beginning.
 Data Source: Reuters
The chart above shows the near-term price action in silver. The orange arrows show resistance levels and possible near-term upside objectives. Like gold, silver is overextended but not as much as its richer cousin.
The fact that both gold and silver are rallying in an environment that would not normally be friendly to either is intriguing. Is it anticipation of a weaker dollar? Is concern over the rapidly-deteriorating political climate in the US and the rest of the world? Is it something else entirely? Whatever the reason, something is stirring in gold and silver.
Using Higher Interest Rates to Create Your Own Gold (or Silver) Backed CD
Combining option strategies with higher interest rates can enable metal investors to take advantage of many of the benefits of owning physical gold and silver for far less risk than owning the metal itself. We’ll explain how this is possible, in greater detail, in further blog posts, but here’s a simple example:
Gold is currently trading for $1,284 per ounce. 100 ounces of gold would cost $128,400 to purchase, not including mark-ups, storage fees, shipping, etc. Let’s say that instead of purchasing $128,400 worth of gold we buy a 1-year FDIC-insured CD yielding 2.81% which would generate a one year return of roughly $3,608. We then take that $3,608 and use it to buy a Comex call option covering 100 ounces of gold.
December 2019, at-the-money, Comex gold calls cost roughly $7,500 each as we write this. $7,500 minus our $3,608 interest payment means our cost of being long 100 ounces of gold is now $3,892. We cannot lose any more than this (plus transaction costs), but we retain almost all of the earning power of owning 100 ounce of gold outright – without markups, storage costs or insurance.
If we wanted to reduce our exposure further, we could add one more step and sell a December 2019 $1,500 Comex call and collect the roughly $2,300 premium which we can use to reduce our $3,892 exposure. $3,892 minus $2,300 equals $1,592. We would not participate in any move over $1,500 per ounce, but would still have a pretty substantial upside. Our maximum risk would only be $1,592 plus transaction costs, combining the CD and both the long and short option. Net profit potential would be $18,408.
Sound intriguing? Watch this space for more detailed explanations as opportunities arise. Visit www.rmbgroup.com to learn more.
Please be advised that you need a futures account to trade the markets in this post. The RMB Group has been helping its clientele trade futures and options since 1984 and are very familiar with all kinds of option strategies. Call us toll-free at 800-345-7026 or 312-373-4970 (direct) for more information and/or to open a trading account. Or visit our website at www.rmbgroup.com.
* * * * * * * *
The RMB Group
222 South Riverside Plaza, Suite 1200, Chicago, IL 60606
This material has been prepared by a sales or trading employee or agent of R.J. O’Brien & Associates (“RJO”)/RMB Group and is, or is in the nature of, a solicitation. This material is not a research report prepared by a Research Department. By accepting this communication, you agree that you are an experienced user of the futures markets, capable of making independent trading decisions, and agree that you are not, and will not, rely solely on this communication in making trading decisions.
DISTRIBUTION IN SOME JURISDICTIONS MAY BE PROHIBITED OR RESTRICTED BY LAW. PERSONS IN POSSESSION OF THIS COMMUNICATION INDIRECTLY SHOULD INFORM THEMSELVES ABOUT AND OBSERVE ANY SUCH PROHIBITION OR RESTRICTIONS. TO THE EXTENT THAT YOU HAVE RECEIVED THIS COMMUNICATION INDIRECTLY AND SOLICITATIONS ARE PROHIBITED IN YOUR JURISDICTION WITHOUT REGISTRATION, THE MARKET COMMENTARY IN THIS COMMUNICATION SHOULD NOT BE CONSIDERED A SOLICITATION.
The risk of loss in trading futures and/or options is substantial and each investor and/or trader must consider whether this is a suitable investment. Past performance, whether actual or indicated by simulated historical tests of strategies, is not indicative of future results. Trading advice is based on information taken from trades and statistical services and other sources that RJO/RMB believes are reliable. We do not guarantee that such information is accurate or complete and it should not be relied upon as such. Trading advice reflects our good faith judgment at a specific time and is subject to change without notice. There is no guarantee that the advice we give will result in profitable trades.