Like people, markets have personalities. Take silver. Silver is rude. Silver is cantankerous. Silver can be fickle. But folks LOVE silver anyway. The “poor man’s gold” has an allure that has stood the test of time, despite being one of the most difficult markets to trade.
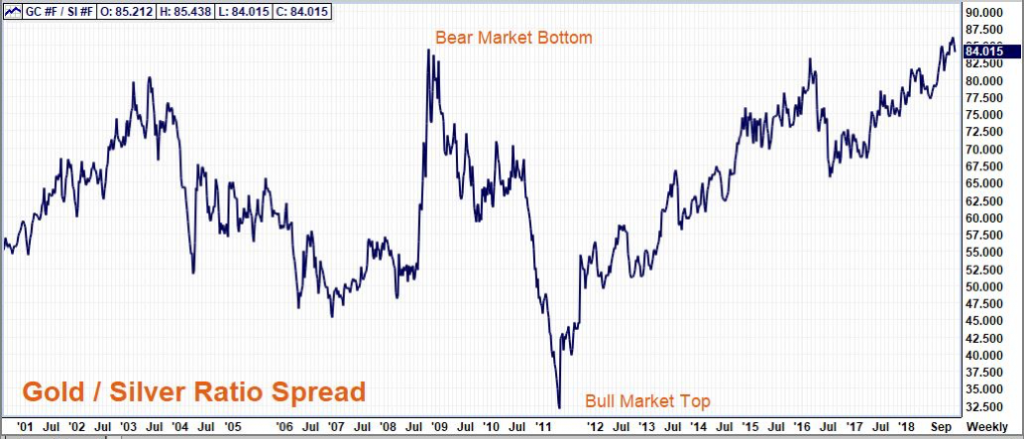
Part of this has to do with its relationship to its richer cousin, gold. When silver is bad it is very, very bad but when it is good, it is unbelievably spectacular. Silver is traditionally more volatile than gold, nearly always outperforming it to the upside in precious metal bull markets and underperforming it to the downside in bear markets. This relationship is particularly visible using the gold / silver ratio which measures how many ounces of silver it takes to purchase one ounce of gold.
 Data Source: FutureSource
In the summer of 2008, silver dipped below $10 per ounce, ending a particularly brutal bear market. Silver was so cheap in relation to its richer cousin that it took over 84 ounces of silver to buy one ounce of gold. That reversed at the top of the 2011 bull market when silver surged above $50 per ounce. It now took just 33 ounces of silver to buy one ounce of gold. Traders that purchased silver, rather than gold, at the bottom of the last precious metal bear market fared well. They made roughly 2.4 times more than those holding gold. This is the allure of silver – its volatility.
But volatility is a double-edged sword. The gold / silver ratio has reverted back to the 84-to-1 level, reflecting overall weakness in both gold and silver. Just as silver benefited to the upside, it suffered to the downside. Is the soaring silver / gold ratio a signal that a bottom is at hand? Maybe. Nevertheless, if you are a silver bull you probably want to strangle silver right now. And you know what? That may not be a bad idea.
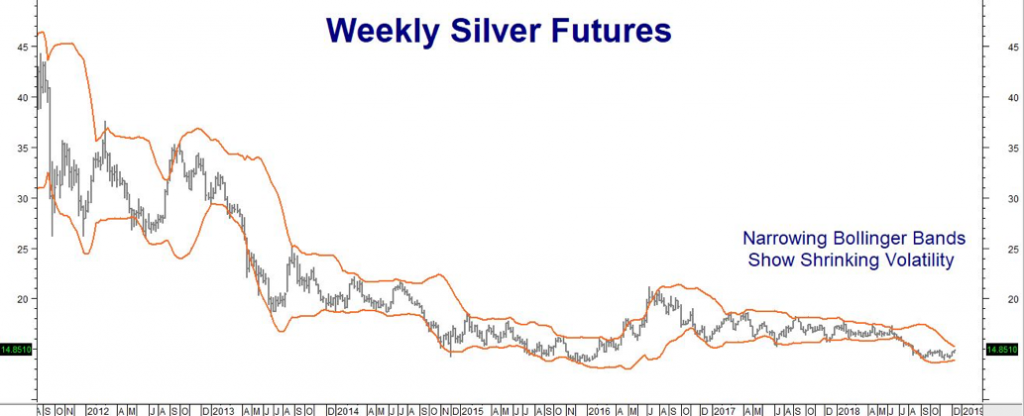
Silver Volatility Is Abnormally Low
If we didn’t know better, we’d be accusing the poor man’s gold of a major personality change. Silver’s slide from its 2011 highs has been accompanied by a huge drop in its overall volatility level. Bollinger Bands measure standard deviations in markets. The orange lines on the chart below represent prices 2 standard deviations above and below the price of COMEX silver futures. Narrowing Bollinger Bands show a marked drop in silver volatility.
 Date Source: Reuters
We do not expect this to last, especially given the potential for big market disruptions after the New Year. The start of a Democratic majority in the US House of Representatives will usher in an era of divided government in America. Add to this tensions in Europe –including the impending failure of an orderly Brexit, a growing banking crisis in Italy and the end of Quantitative Easing (QE) by the European Central Bank (ECB) – and mix in the ongoing trade war with China, and you get a volatile cocktail that could produce a massive post-holiday hangover in many markets.
Silver Could Be Pulled In Either Direction
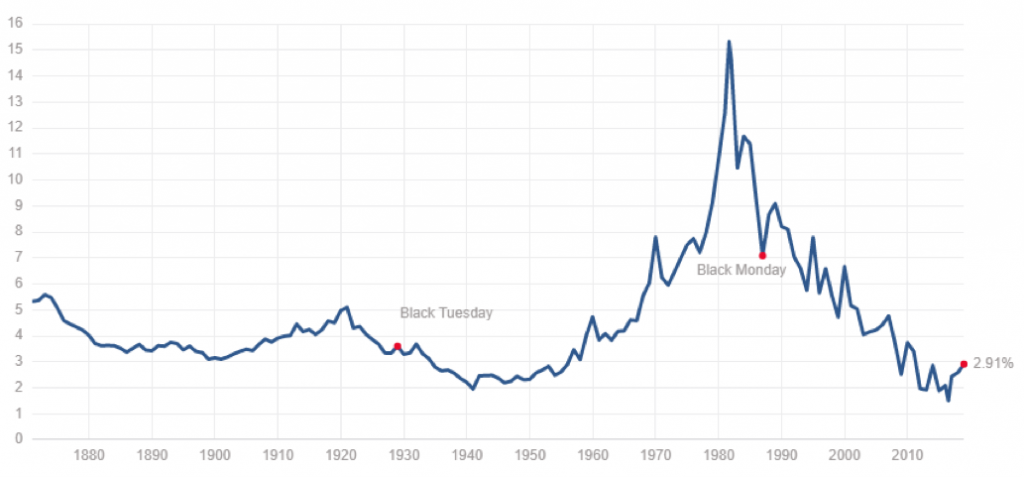
There are a number of scenarios that could result. Perhaps the most bearish for silver would be a resumption of the higher interest rate trend in the US. The current selloff in the US stock market is doing its best to put an end to rising interest rates. Plummeting stocks have caused investors to flock to the relative safety of bonds.
Bonds have also been helped by extremely low interest rates in Europe. A yield of 2.91% on US T-Notes doesn’t look too good by itself, but appears much better compared to the current yield of roughly 0.25% on 10-year German Bunds. We expect German yields to rise in the wake of the ECB’s decision to end Quantitative Easing, making US Treasury debt less attractive and more vulnerable to increases in yield.
Ten-Year T-Note Yield
 Source: www.multpl.com
Higher rates are typically bullish for the US dollar because they increase the relative rate of return on US dollar-based investments. But they are bearish for the prices of gold and silver. A strong dollar means it takes fewer of them to buy the same amount of metal – causing the dollar price of silver to decline.
Rising rates also increase the opportunity costs of holding silver. Silver does not earn interest and it costs money to store it. A return to a rising rate environment could be enough to cause silver investors to exchange their metal for more lucrative, yield-producing investments. Investment (or disinvestment) in silver is the prime driver of its direction. When investors want silver, it soars; when they don’t, it sinks.
But higher interest rates in Europe could also be bullish for silver depending on how fast European interest rates increase now that the ECB’s Quantitative Easing campaign is ending – especially if European rates begin to rise faster than US interest rates. A faster rise vis-à-vis US rates would benefit the Euro, putting pressure on the dollar. A weak dollar tends to be good for silver. So does today’s political uncertainty. Either way, we expect the stasis in the silver market to end soon.
How to “Strangle” Silver
Market volatility affects option traders’ expectations. The more volatile a given market, the more expensive its options tend to be. Because silver has a history of being a more volatile market, silver options tend to be very expensive. The recent quiet in silver means its options are about as cheap on a relative basis as we have seen on a long time. Silver options are cheap enough to consider a strategy that has the potential to gain on a breakout in either direction. This strategy involves the purchase of a put option and a call option. It is called a “strangle” in option-trader jargon.
Buying the call gives us the right, but not the obligation, to be long the underlying silver futures at the strike price of the call. Buying the put option gives us the right, but not the obligation, to be short silver at the strike price of the put. The key phrase is “but not the obligation.” Failure of silver to either rally above the strike price of the call or below the strike price of the put means we would forfeit the amount we pay for our “strangle,” but no more. A big move in either direction could result in outsized gains. We’ve listed two trades we are looking at below. Visit us at www.rmbgroup.com to learn more.
 Data Source: Reuters
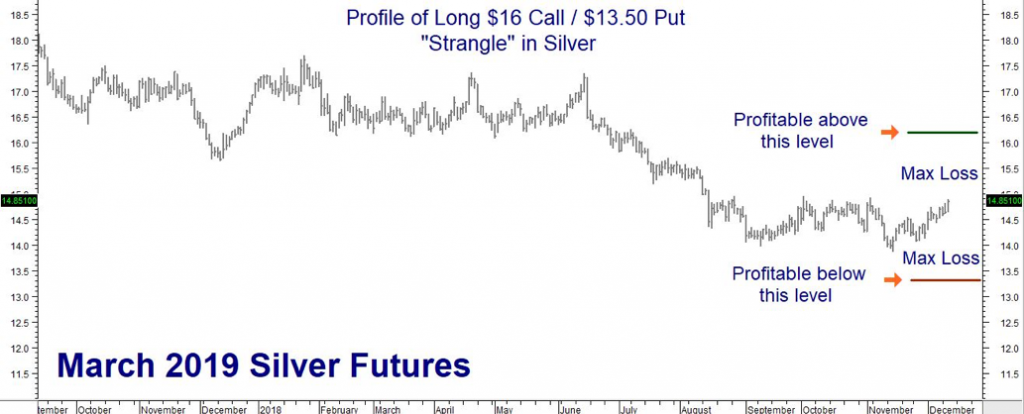
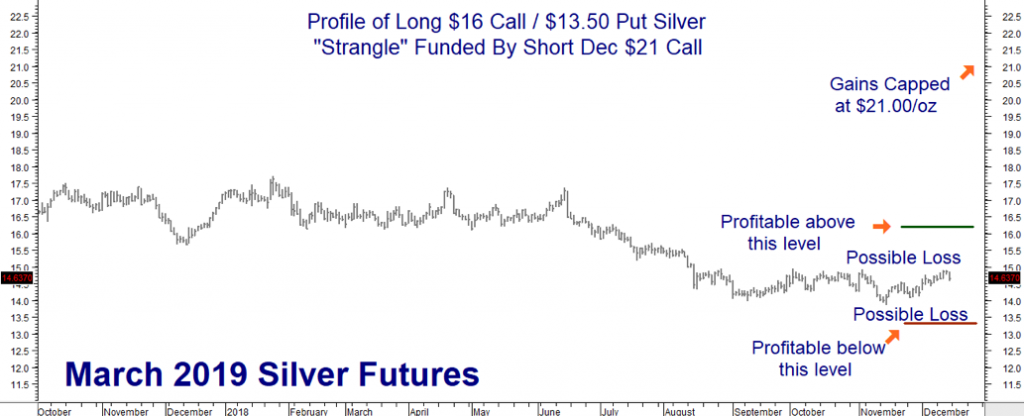
“Strangle” #1: Consider purchasing a March $16.00 call and a March $13.50 silver put for a combined cost of 16 cents ($800), looking for the poor man’s gold to break out of its narrow trading range prior to the expiration of March silver options on February 25. This trade will be worth $5,000 for every $1.00 per ounce move over $16.00 per ounce or below $13.50 per ounce (see chart above.) The maximum risk is $800 plus transaction cost. This trade is currently trading for $900, so patience may be required to get our $800 price.
 Data Source: Reuters
Strangle #2: Consider Strangle #1 trade above, but fund it by also selling a December 2019 21-cent silver call and using the money you receive to help pay for “Strangle #1.” You can then use whatever time-decay you get from the call to help offset some of the $800 cost of the strangle. Make sure you exit the short December call either the day before the February 25, 2019 expiration of the March $16.00 call or simultaneously when exiting the March $16.00 call, whichever occurs first.
The risk on this trade is fixed as long as the short December 2019 $21.00-cent call is covered by the long March $16.00 call. Normal time decay on the short December $21.00 call should lower the $800 cost of Strangle #1, provided it is exited at the same time as the March $16.00 call.
Please be advised that you need a futures account to trade the markets in this post. The RMB Group has been helping its clientele trade futures and options since 1984 and are very familiar with all kinds of option strategies. Call us toll-free at 800-345-7026 or 312-373-4970 (direct) for more information and/or to open a trading account. Or visit our website at www.rmbgroup.com.
* * * * * * * *
The RMB Group
222 South Riverside Plaza, Suite 1200, Chicago, IL 60606
This material has been prepared by a sales or trading employee or agent of R.J. O’Brien & Associates (“RJO”)/RMB Group and is, or is in the nature of, a solicitation. This material is not a research report prepared by a Research Department. By accepting this communication, you agree that you are an experienced user of the futures markets, capable of making independent trading decisions, and agree that you are not, and will not, rely solely on this communication in making trading decisions.
DISTRIBUTION IN SOME JURISDICTIONS MAY BE PROHIBITED OR RESTRICTED BY LAW. PERSONS IN POSSESSION OF THIS COMMUNICATION INDIRECTLY SHOULD INFORM THEMSELVES ABOUT AND OBSERVE ANY SUCH PROHIBITION OR RESTRICTIONS. TO THE EXTENT THAT YOU HAVE RECEIVED THIS COMMUNICATION INDIRECTLY AND SOLICITATIONS ARE PROHIBITED IN YOUR JURISDICTION WITHOUT REGISTRATION, THE MARKET COMMENTARY IN THIS COMMUNICATION SHOULD NOT BE CONSIDERED A SOLICITATION.
The risk of loss in trading futures and/or options is substantial and each investor and/or trader must consider whether this is a suitable investment. Past performance, whether actual or indicated by simulated historical tests of strategies, is not indicative of future results. Trading advice is based on information taken from trades and statistical services and other sources that RJO/RMB believes are reliable. We do not guarantee that such information is accurate or complete and it should not be relied upon as such. Trading advice reflects our good faith judgment at a specific time and is subject to change without notice. There is no guarantee that the advice we give will result in profitable trades.