RMB Group has been trying to make sense of the volatility that has defined stocks and other key asset classes since the S&P 500 topped out in unspectacular fashion in late September. Is this two-month selloff a major top and the start of a punishing bear market? Or is it a healthy correction and a screaming buying opportunity?
To quote baseball legend Yogi Berra, “You can observe a lot by just watching.” Here are three things that have caught our eye:
Observation #1: The 200-Day Moving Average Is in Play
Nearly everyone pays attention to the 200-day moving average in the S&P 500. That’s because it smooths the often chaotic day-to-day movement of the stock market, eliminating daily knee-jerk reactions which often end up being just “noise.” Bull markets are defined by rising prices over time. Bear markets are defined by declining prices over time. As the chart below illustrates, the 200-day moving average does a good job of indicating which type of market environment exists at any point in time.
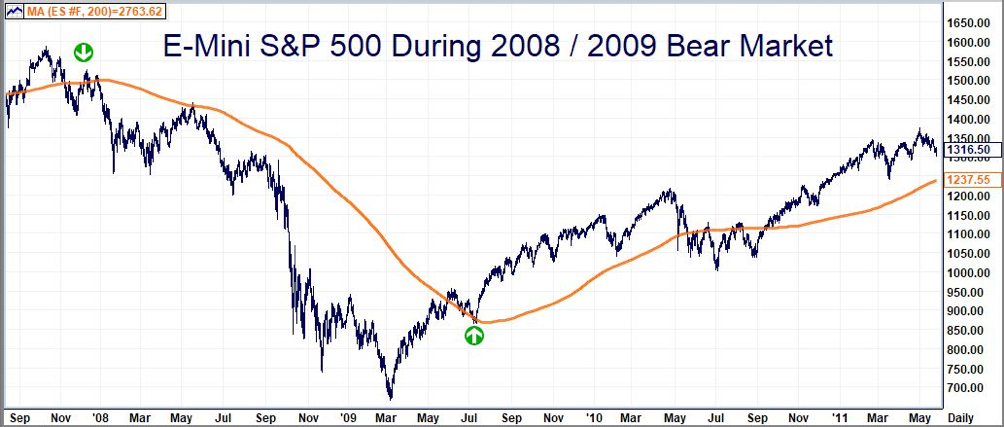
A bull market will test, but not trade below, the 200-day moving average for any significant length of time. A bear market will not trade above the 200-day moving average for any significant length of time. This is what the last bear market looked like in the E-mini S&P 500 futures:
Data Source: FutureSource
The 200-day moving average is represented by the orange line in the chart above. The green “down” arrow shows where the bear market began. E-mini S&P 500 futures dipped below the 200-day moving average and were unable to climb back above it in any significant way for the rest of the bear market. The green “up” arrow shows when they finally did – effectively ending the bear market and signaling the beginning of the longest bull market in history.
Data Source: FutureSource
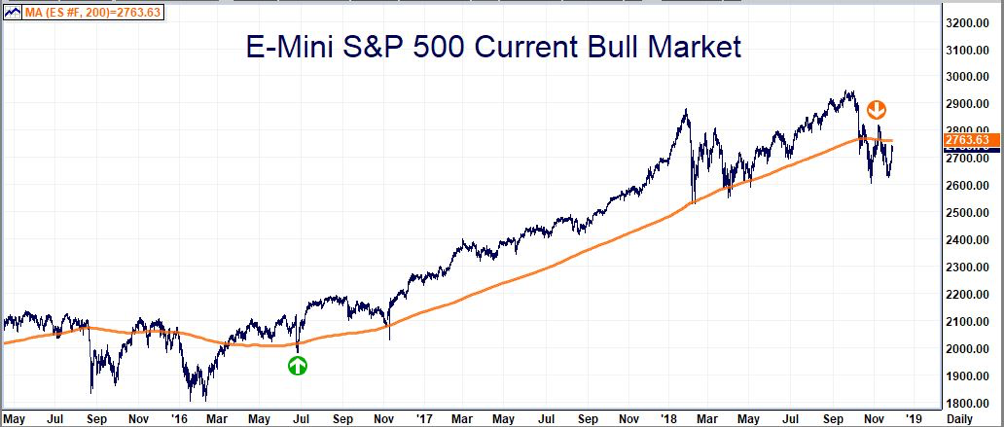
The chart above illustrates the latest leg of the current bull market. Prices bottomed following the election of Donald Trump in November 2016. But this leg of the bull wasn’t really detectable until the E-mini futures were able to hold above the 200-day moving average. The market tested the 200-day moving average in July following the election (green “up” arrow) and bounced, making new highs in the process. This was the signal that the bull was off and running again.
Trading became more volatile in March 2018 with the onset of the Trump tariffs. These spurred retaliatory actions by China and other US trading partners, but the E-mini was able to hold above the 200-day moving average due to strong profit numbers generated by huge corporate tax cuts. Great quarters posted by most S&P 500 companies largely offset the negative effects of the Trump tariffs. The stock market may have been more volatile, but it was still a bull market.
Watching the latest signal given by the 200-day moving average (the orange “down” arrow on the chart above) brings us to this simple observation: stocks are no longer in a bull market…but they not in a bear market either. Stocks have crossed the 200-day moving average to the upside as we write this, rallying on the news of a truce in the US / China trade war.
Until the E-mini can manage a series of closes above old swing highs at 2818 and prove that it can put some upside distance between its price and the 200-day moving average, the very best one can say about stocks right now is that they are in a volatile, sideways market with a downside bias. Similarly, it will take a few solid closes below old lows at 2603 – and some downside distance below the 200-day moving average – to confirm a new bear market. Without confirmation either way, stocks will remain in a volatile “Never Never Land.”
Observation #2: Tax Cut “Sugar High” Fueled Summer Rally
We’ve been watching what has happened to the trillion or so dollars of fiscal stimulus generated by the Trump tax cut and observed that much, if not most, of the proceeds were spent by corporations buying back their own stock. In the parlance of Wall Street, this is known as “returning capital to shareholders.” That definition holds up only if shareholders sell their stock after appreciation due to the buy-back and cash those gains in.
Buy and hold shareholders may own slightly more of a company due to the reduction in outstanding shares, but unless they cash their stocks in, they will gain absolutely nothing if the stock they hold fails to increase due to a buy-back. If a company’s shares fall after a buy-back, stockholders will lose just as much as they would have if the buy-back never happened.
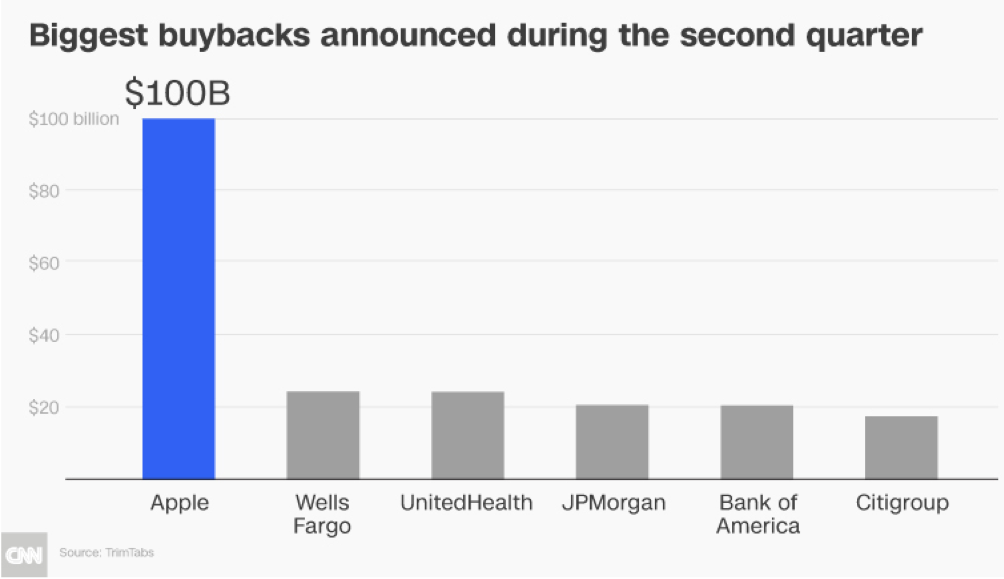
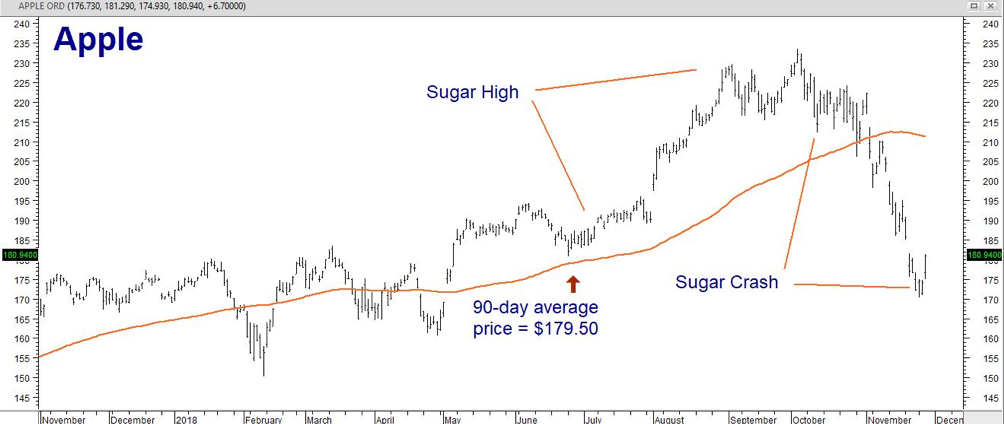
Take the case of Apple. Apple bought back over $100 million of its shares in the second quarter of 2018 as a result of the tax cut. Let’s assume it paid an average price of $179.50 per share. (We use that number because it is the 90-day moving average of Apple’s stock on the last day of the 2nd quarter.) Apple soared following the sugar-high generated by its huge buy-back, surging to $232.00 per share. But like all sugar highs, Apple’s had to end. Its shares are right back where they were at the end of the second quarter.
We use Apple because it is a pretty good proxy for the market in general. However, the market as a whole is full of other tax-cut buy-back stories just like this. Take a look at any of the FAANG stocks that have been responsible for the lion’s share of the recent bull market’s gains and you will see similar price action.
The 2018 tax cuts were part of a one-time economic stimulus that appears to have lost its ability to stimulate. If the market continues to head south, much of it will simply disappear, leaving generations of taxpayers on the hook with little to show for it. These taxpayers will be in no mood to rush to the rescue next time.
Observation #3: Interest Rates Are Rising
This should be enough to cause any stock market investor to get nervous. Interest rates measure the price of money. Low interest rates make it easy for businesses to borrow and hard for savers to save. High interest rates do precisely the opposite. The currently risk-free rate of returns on instruments, like bank CDs and T-bills, are now higher than the dividend yield on the S&P 500 – and have been most of 2018.
You can now buy a 1-year, FDIC-guaranteed CD for a yield of 2.70%. The S&P 500 currently yields 1.8%, nearly a full percentage point less. Should this spread hold up or widen, conservative investors will start replacing portions of their stock portfolios with safer, higher-yielding investments. This reduces the pool of money for business investment. Not surprisingly, new business investment which surged 11.5% directly following the tax cuts has fallen back, rising only 0.8% in the third quarter.
Stocks are forward looking. Not only are they anticipating a global slowdown caused by tariffs now that the tax cut “sugar high” has worn off, they are expecting further increases in the cost of doing business due to rising interest rates. This is a reason why rallies as a result of “good news” have become far shorter, and declines due to “bad news” last much longer.
By holding interest rates artificially low during most of the nine years since 2009, the Fed left investors no choice. If you wanted your money to grow, you had to be in stocks. This is no longer the case. Higher rates mean investors now have less-risky alternatives that are doing a pretty good job of keeping pace with inflation. Not surprisingly, they are taking advantage of them.
A struggling stock market may not be the only negative effect of higher interest rates. Global debt is exploding. The Trump tax cuts have added over $1 trillion to the US deficit. China’s debt just rose above 300% of GDP. When interest rates are falling, governments and businesses can “extend and pretend” by using the proceeds on new, lower-cost debt to pay off older, more expensive debt. This is why the Fed reduced interest to ridiculously low levels. Doing so enabled bankrupt institutions to crawl out of the holes they dug for themselves.
A rising interest rate environment makes “extend and pretend” impossible. More money needs to be set aside for debt service. For governments, this leaves less for providing services. For businesses, this means fewer dollars to invest in growth. A rising interest rate environment also has the potential to negatively impact the banking system which relies heavily on no-cost checking and low-cost saving accounts for the reserves to stay in business. Cheap reserve dollars are rapidly disappearing as depositors flock to higher yielding investments – putting the financial health of the banking system in play once again.
Bottom Line: Volatility Is Here to Stay
It is highly likely that without further outside stimulus, either from lower interest rates or more fiscal pump priming (infrastructure perhaps?), stocks will not be able to generate the types of returns they have during their incredible 9-year bull market. The bull market, if we believe the 200-day moving average, may have just ended.
We’ve written before about how much today’s current political, social and economic environments remind us of the late 1920s. While we are not necessarily predicting the next Great Depression, we do believe that changing economic and political realities are leading us closer to a critical inflection point. There are forces currently afoot that could cause major upheaval in the best-laid financial plans. As we’ve pointed out in the past, many investors are not ready for the coming storm. That’s why having a “Plan B” in place is so important.
The future is ultimately unknowable. However, the one thing we can be fairly certain of is that the kind of volatility we’ve been witnessing is going to hang around for a while longer. Because managed futures are not correlated to the movement of stocks and bonds, they are an excellent way to diversify a traditional portfolio heavy in stocks and bonds.
Managed futures are able to make money in both up and down markets in asset classes like stocks, bonds, energy, agricultural commodities and foreign currencies. They are excellent diversification tools for investors looking for something with the potential to “zig” when everything else “zags.”
Managed futures programs are run by professional traders known as CTAs (Commodity Trading Advisors), many of whom are extremely comfortable trading in volatile markets. CTAs who offer their services to the public must provide Disclosure Documents explaining the markets they trade, an overview of the methods they use to trade and audited track records showing their performance.
Big investors like family offices and pension funds have been using managed futures as essential components of their “Plan Bs” for years. Individual investors can do the same. If you would like to learn more about managed futures, you can download our short course, Opportunities Outside the Stock Market. This easy-to-read primer will teach you everything you need to get started.
You can also call us at 800-345-7026 (toll-free) or 312-373-4970 (direct) and speak with one of our managed futures specialists. They will be happy to provide you a list of all the managed futures programs we are currently following and help you decide which one would be a good fit for your portfolio.
* * * * * * * *
The RMB Group
222 South Riverside Plaza, Suite 1200, Chicago, IL 60606
This material has been prepared by a sales or trading employee or agent of R.J. O’Brien & Associates (“RJO”)/RMB Group and is, or is in the nature of, a solicitation. This material is not a research report prepared by a Research Department. By accepting this communication, you agree that you are an experienced user of the futures markets, capable of making independent trading decisions, and agree that you are not, and will not, rely solely on this communication in making trading decisions.
DISTRIBUTION IN SOME JURISDICTIONS MAY BE PROHIBITED OR RESTRICTED BY LAW. PERSONS IN POSSESSION OF THIS COMMUNICATION INDIRECTLY SHOULD INFORM THEMSELVES ABOUT AND OBSERVE ANY SUCH PROHIBITION OR RESTRICTIONS. TO THE EXTENT THAT YOU HAVE RECEIVED THIS COMMUNICATION INDIRECTLY AND SOLICITATIONS ARE PROHIBITED IN YOUR JURISDICTION WITHOUT REGISTRATION, THE MARKET COMMENTARY IN THIS COMMUNICATION SHOULD NOT BE CONSIDERED A SOLICITATION.
The risk of loss in trading futures and/or options is substantial and each investor and/or trader must consider whether this is a suitable investment. Past performance, whether actual or indicated by simulated historical tests of strategies, is not indicative of future results. Trading advice is based on information taken from trades and statistical services and other sources that RJO/RMB believes are reliable. We do not guarantee that such information is accurate or complete and it should not be relied upon as such. Trading advice reflects our good faith judgment at a specific time and is subject to change without notice. There is no guarantee that the advice we give will result in profitable trades.