Futures Outlook: 09/10/13
What Has Your Dollar Done For You Lately
The mighty/ not-so-mighty US Dollar is going to be the topic of discussion today. The plight of the US Dollar has been discussed in financial circles ad nauseam and as the decline just kept continuing it bled through to mainstream media. Even McDonald’s had a commercial a couple of years ago highlighting the failure of the US Dollar. Today we’ll take a look at the charts and see how she fares currently.
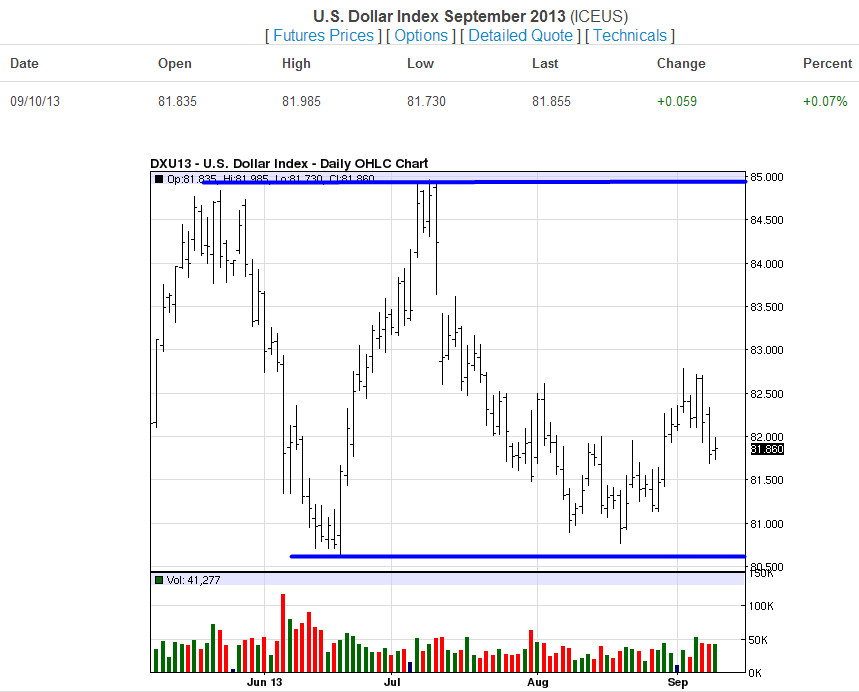
U.S. Dollar
Via the Daily chart, our U.S. Dollar Index has been range bound between the area around 80 and the area around 85. It has been in this channel of sorts since at least June of this year. On the Daily chart, I want you to notice that it is having a bit of a tough time of gathering its upward momentum on this round of push. We have retraced on the latest bullish drive, but we have retraced to a point where we may actually start to break the back of the climbing effort.
Moving forward to our Weekly chart:
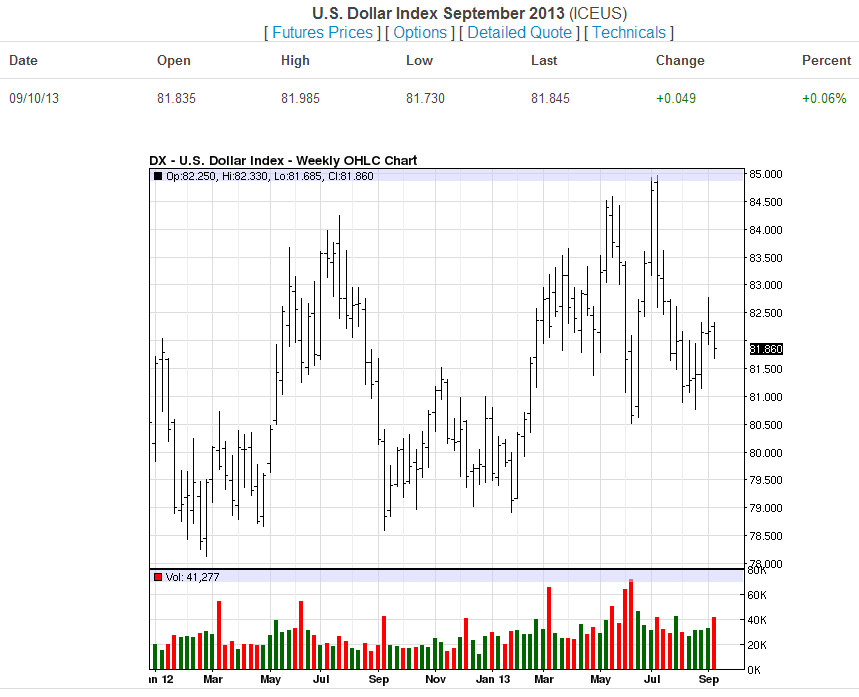
You can see that we have been creeping upward since September of last year via this chart. If you look closely you can try to talk yourself into an ascending channel, but it really isn’t all that clean. We have basically been in that 80-85 range illustrated on the daily chart all year long. The thing to watch here from a week to week perspective is the tightening action that we are getting and once again the fact that our latest bullish push was unable to make a large dent in what needs to be recovered in order to gain on the 85 level and break it. At this point it looks like we are stalling and if nothing comes through on the fundamental side of things to help give it strength, we could easily falter again and break the ascending trend line.
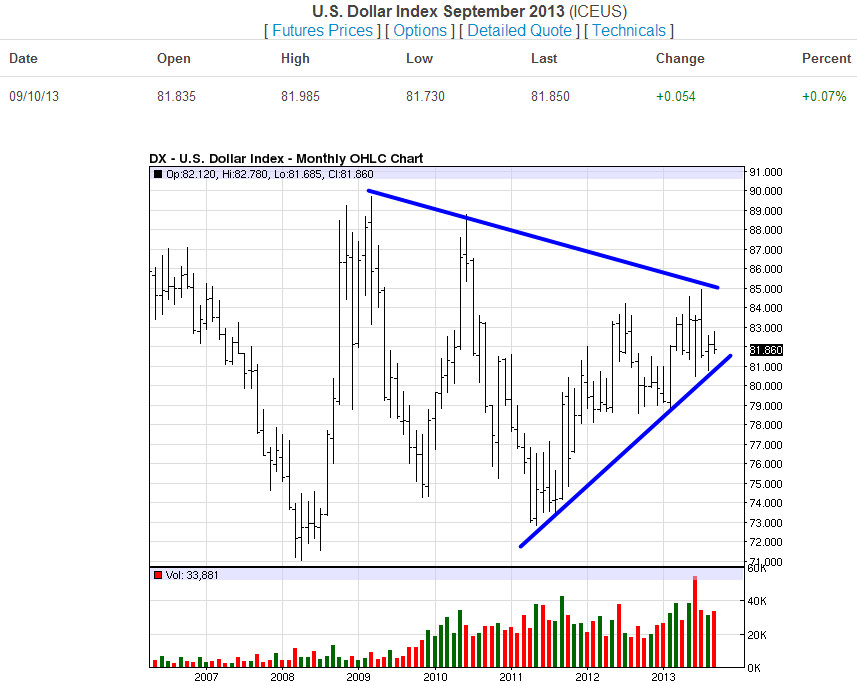
When looking at the Monthly chart, I have highlighted edges that illustrate the triangular pattern that the U.S. Dollar seems to be forming. As it is tightening up on the Monthly chart as well, right now might be a very good time to start watching to see which way it pops. In addition, for those of you who might have thought that the U.S. Dollar has just kept losing ground year after year, I would draw your attention to the fact that technically speaking she has gained ground over the last 5-6 years. The gain has not been steady in one direction, nor great in the recovery, but the renewing strength has been present.
Now, I would like to take it to a much broader perspective.
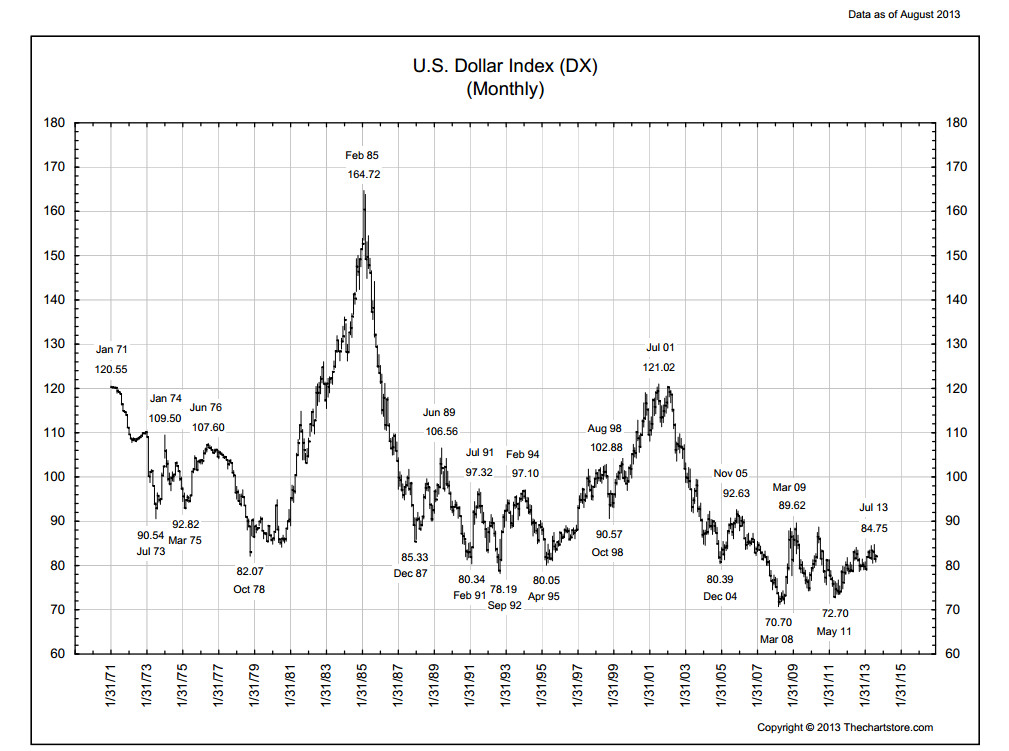
Via this month by month chart that spans 42 years so far, you can see the bigger picture. Our triangular pattern on the Monthly chart actually began to form its top line with the descent that began around 2006. We have truly been in a tightening pattern from the point it failed from November 2005 at 92.63 and hit bottom in March 2008 at 70.70. From a long term perspective, the area around 80 seems to be a comfortable place for the U.S. Dollar to reside, but with the tightening action of late, we may get a burst of energy to shake things up a bit.
So, what do you do when you feel like something may happen in a market like this, but you don’t know which direction to take? Think about using Options to create strategies not only for the potential break, but also potentially for the sideways action.
If you would like to learn more about strategies that you can employ to participate in the market of the U.S. Dollar, feel free to contact us directly. Remember, that we are here to keep your options clear.
Lindsay Hall is Chief Market Strategist with commodities specialists RMB Group. Get the latest futures and commodities commentary from Lindsay and the RMB Group on our Big Move Trades–an online report offering trading ideas backed by research.
Questions about this report or trading futures? Contact us online or at 1-800-345-7026. Follow us on Twitter @RMBGroupFutures