Sun Should Shine on Silver Soon
Silver has a dual personality. Like gold, it is a precious metal and, because it is cheaper than gold and accessible to many more investors, nearly always outperforms its richer cousin in gold bull markets. Silver is also a strategic and industrial metal, used heavily in electronics. This can drag silver down vis-à-vis gold during slow-growth periods and bear markets, but can also work in silver’s favor when the economy heats up.
One of the most rapidly-growing industrial uses for silver is solar panels. Demand for solar panels keeps increasing as advances drive down the cost of solar-generated electricity. New technologies and manufacturing processes mean that the cost to produce a kilowatt hour of solar power is rapidly approaching that of natural gas. Combine this with leaps in battery technology and the future for solar panels looks even brighter. Silver will be a key part of that future.
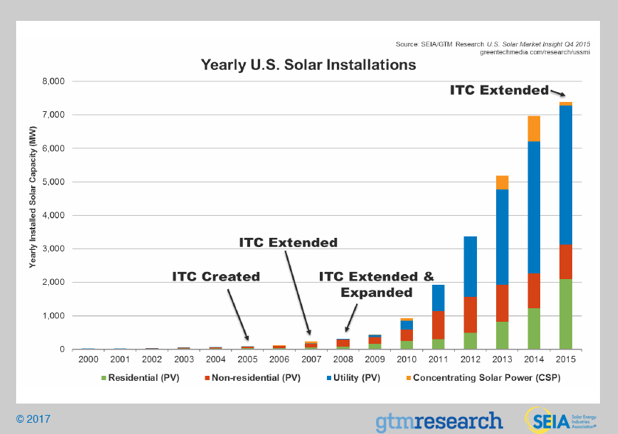
On the graph above, look at how much of the growth in US solar installation (blue shaded area) comes from utilities. Expect this to rise as solar costs continue to drop, favoring large solar installations over new fossil-fuel plants.
Chinese solar demand could skyrocket as well. China has a huge air pollution problem caused by its reliance on coal for electricity generation. Unhealthy air is probably one of the biggest challenges the Middle Kingdom faces over the next decade. Not only is it damaging to lungs, it is also a drag on the economy – especially in big cities like Beijing that suffer when manufacturing and driving get shut down because of dangerous air quality. China is the globe’s biggest supplier of solar panels. Many more of those panels will be needed if China is serious about cleaning the air in its smog-choked cities.
Photography Demand Slowly Being Replaced By Solar
Industrial demand has declined since peaking in 2011 largely due to the loss of traditional photography. Silver oxide is a key component of photographic film. With the bulk of photography now digital, demand for silver in the film industry has dropped substantially. Solar is helping take up some of the slack.
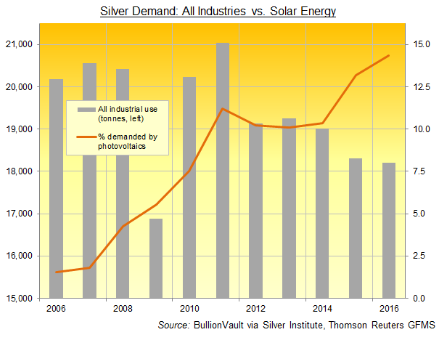 77.6 million ounces of silver were used to fabricate solar panels in 2015, accounting for approximately 7% of total demand. With the solar cell market expanding 20% per year, we expect that number to climb significantly once the final numbers for 2016 are tallied.
Because silver is one of the best conductors of electricity known to man, silver paste is used as a conductor on both the front and back of crystalline solar cells. Roughly 120 to 150 milligrams are used for each cell. As demand for solar panels continues to grow, so should the demand for silver.
Silver Demand Exceeding Supply Again
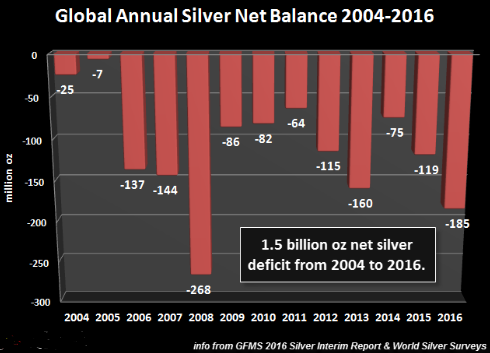
One of the biggest conundrums for silver investors is its supply / demand profile. Silver demand has exceeded supply for 12 straight years with seemingly little effect on price. Global silver demand hit a new record in 2016 – increasing 2.8%. Mine supply dropped 0.7% and total supply dropped 2.2%, down 6% from its 2010 peak.
With a cumulative deficit of 1.5 billion ounces from 2004 through 2016, one would expect the market to drive prices higher to encourage more production. That hasn’t happened. The failure of silver to rally despite a growing supply deficit has led to a cottage industry based on the notion that silver prices are manipulated. We are not fans of easy answers. This makes us extremely wary of conspiracy theories in general and the silver manipulation argument in particular.
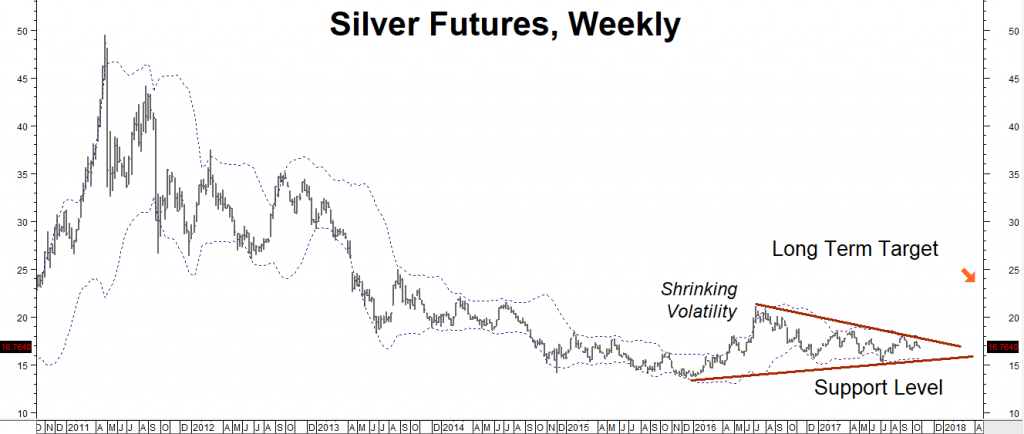
Silver does adjust to deficits but tends to do so rapidly, leaving all but the most dedicated bulls behind. Its volatile nature means price tends to overshoot fair value. Silver soared in 2010, rallying from just under $15 per ounce in early February to a high of $49.50 just 14 months later – an eye-popping gain of 230%.
Silver was too cheap at $15 per ounce and too expensive at $49.50 per ounce. One of the reasons it climbed so high in such a short span of time was the Fed. The Federal Reserve’s massive bond-buying stimulus plan affectionately known as Quantitative Easing (QE) began in 2008 in response to the financial meltdown caused by the housing crisis. In 2010, the Fed announced QE2, doubling down on the bet it made in 2008. This led to fears that the Fed’s actions would be inflationary. Both silver and gold soared as a result.
Producers used the massive 2010 rally in silver to lock in favorable prices by selling futures contracts. This and the failure of QEs 1, 2 and 3 to provide any meaningful inflation set the stage for the 6-year bear market which followed, appearing to be on the verge of ending. Now that prices have drifted back to $15 per ounce, we would not be surprised to see another volatile upside adjustment. This might be in response to silver’s growing cumulative deficit and the potential for increasing inflation.
Data Source: Reuters/Datastream
Inflation Is Not Dead
The United States and China are the two largest economies in the world. They account for 40% of global demand. Both are pursuing inflationary policies – the effects of which we may have just begun to feel. Nearly a decade of artificially-low interest rates in the US have pumped over a trillion dollars into the economy. Much of this has either remained on the sidelines or been injected into the stock market.
Add to this trillions more from potentially budget-busting Trump tax cuts and infrastructure spending. The Trump crackdown on immigration means there are fewer low wage workers available to fill positions. Visa restrictions are hitting seasonal businesses particularly hard. Wages will need to rise to induce domestic workers to step in. Bottom line? Inflation may not be getting a lot of press yet, but it is definitely here and growing.
Noted economist Brian Westbury forecast the potential return of inflation well before the last US presidential election. Here are insights from an October 10, 2016 white paper he helped author:
“Just look at housing costs – a non-traded good – which makes up one-third of the CPI. Government statisticians measure this as “Rent of Shelter,” which includes normal rents, hotel costs, and owners’ equivalent rent (the rental value of owner-occupied homes). It’s up a whopping 3.4% in the past year and has accelerated in each of the past six years…
“…Although some (usually Keynesian) analysts are waiting for much higher growth in wages before they fear rising inflation, the fact is that wage growth is already accelerating. Average hourly earnings are up 2.6% in the past year versus a 2.0% gain only two years ago. Moreover, as a paper earlier this year from the San Francisco Fed pointed out, this acceleration is happening in spite of the retirement of relatively high-wage Baby Boomers and the re-entry into the labor force of workers with below-average skills.
“But we don’t think wages cause inflation – money does. Inflation is too much money chasing too few goods. The Fed has held short-term interest rates at artificially low levels for the past several years while it’s expanded its balance sheet to unprecedented levels. Monetary policy has been loose.
“But banks have held most of the Fed’s Quantitative Easing (QE) as excess reserves. Banks have record loans on their books, but they also hold $2.2 trillion in excess reserves. Most people believe QE was, and is, temporary. So banks have been reluctant to lend it out. After all the Fed could withdraw the reserves, unwind QE, and banks would be forced to “call” their loans.
“But as the Fed has postponed the process of reducing its balance sheet, banks have started to expand the M2 money supply. M2 grew roughly 6% annualized between January 2009 and December 2015. But, so far this year, from January to September, M2 has expanded at an 8.6% annualized rate. More money brings more inflation.”
China is also guilty of artificial stimulation, often intervening directly in its stock and real estate markets. Chinese stimulation of its housing sector is a big factor in the 30% jump in house prices in Beijing and Shanghai and incredible 70% pop in Shenzen. The Chinese also have a history of using metals as stores of value, especially during inflationary periods. Big rallies in copper (up 30%) and zinc (up 40%) were helped along by Chinese stockpiling. Will silver be next?
Silver Is Cheap Compared To Gold
Data Source: FutureSource
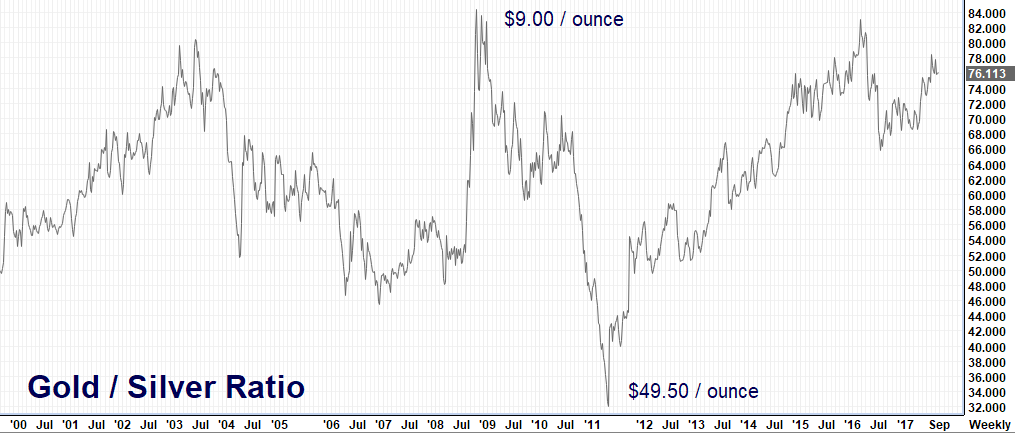
Metal traders monitor the relationship between gold and silver using the “gold/silver ratio.” It measures the amount of silver (in ounces) needed to purchase one ounce of gold. Gold is 15 times rarer than silver. When silver and gold were considered money, gold would trade at a premium of roughly 16 times that of silver. It currently takes 74.5 ounces of silver to buy one ounce of gold – making it inexpensive compared to its richer cousin. Those who want to place a bet on higher precious metal prices might do well to consider silver first.
Because it is a much more volatile market, silver tends to outperform gold during bull markets and underperform gold during bear markets. This means the gold / silver ratio is usually at its low when silver prices are highest and at its high when silver prices are at their lowest. Using history as a guide, silver should lead the next bull market in metals.
Dollar Bull Market Is History
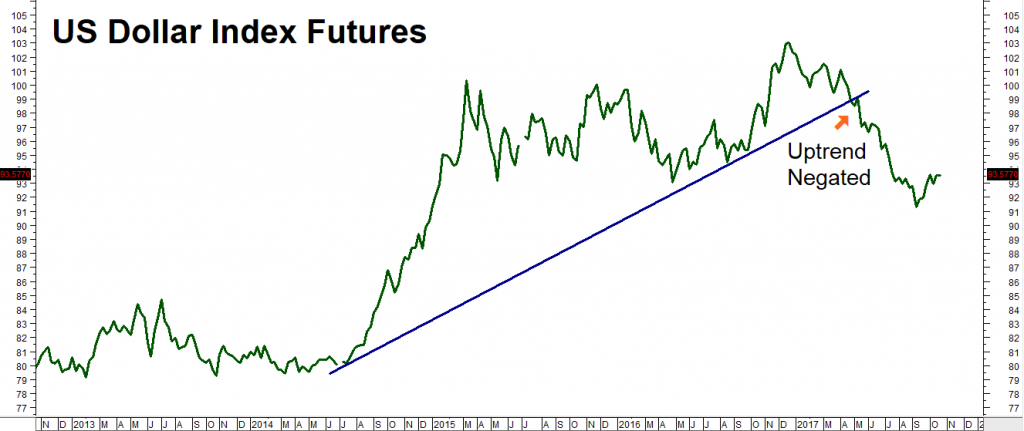
One of the factors that has helped keep a lid on both gold and silver is the strong US dollar. The US Federal Reserve was the most aggressive of the world’s central banks following the 2008 housing crash. Zero interest rates and three rounds of quantitative easing caused the American economy to recover more quickly than Europe. Lower US interest rates led to a weaker dollar and help fuel a faster recovery. The weak dollar was also a key player in silver’s 2010 moon shot. Silver (and gold) are priced in dollars. When the dollar is weak, more of them are required to purchase the same amount of silver or gold.
Data Source: FutureSource
America’s ability to recover more quickly from the 2008 crisis enabled it to raise interest rates sooner than Europe, strengthening the dollar to the point where the American Greenback is now one of the strongest major market currencies. Gold and silver have suffered as a result. But things may be changing…
The European recovery appears to be gaining momentum. At the same time, America’s new president favors a weaker dollar. Donald Trump’s pronouncement that the dollar is “too strong” was heard by currency traders the world over. A quick look at a US Dollar Index chart shows a dollar that has spent the last 2 ½ years chopping sideways in a wide trading range. Recent price action is threatening the uptrend begun last summer.
Further cracks in the dollar should be very good for silver. Mix in growing global tensions (including the very real potential of a shooting war with nuclear North Korea), a new American president who hasn’t found his sea legs yet, as well as the inflationary policies of the globe’s two largest economies and you have all the ingredients to ignite a big move in silver. Exploding solar demand is just the cherry on top.
How to Play It
Will it happen? We don’t know. However, we are willing to wager a relatively small amount that a big move in silver is coming. While we don’t expect the 230% gains of 2011, we certainly think it is possible for silver to rally to $24 per ounce in the coming months.
That’s why we suggest trading clients consider buying December, 2018 $21 / $24 bull call spreads using COMEX silver options for $1,500 each or less. If we are wrong and silver does not rally, the most we can lose is the $1,500 (or less) that spend plus transaction costs. These spreads could be worth as much as $15,000 should silver rally to $24 per ounce on or prior to option expiration. Expiration in late November 2018 means this position won’t expire until after the 2018 mid-terms.
How the Trade Works
The trade suggested above is created by purchasing December 2018 $21 Comex silver calls and simultaneously selling an equal number of December 2018 $24 silver calls for a net price of $1,500 or less. The long $21.00 call option give us the right but not the obligation to be long 5,000 ounces of silver at a price of $21.00. We pay money for this right. To help pay for this call, we also sell December $24 calls and collect money in exchange for the obligation to sell a 5,000 ounces of silver at a price of $24. We can then use this money to help offset part of the cost of our long $21 calls.
We are essentially pairing the right to be long silver at $21 per ounce with the obligation to sell silver at $24 per ounce which means we can make the $3 per ounce difference. Multiply $3 per ounce times the 5,000 per ounce contract size and you get a gross potential of $15,000 per position. If silver fails to rise to $21 before our options expire on November 27, 2018, we simply won’t exercise our right to be long and will forfeit the $1,500 (plus transaction cost) our spreads cost us – but no more. If we are right, our $1,500 could turn into as much as $15,000.
Getting Started
Please be advised that you need a futures account to trade the recommendations in this report. The RMB Group has been helping their customers trade futures and options since 1984 and are very familiar with the strategies suggested in this report. Call us toll-free at 800-345-7026 or 312-373-4970 direct to learn more. We’ll send you everything you need to get started. You can also visit www.rmbgroup.com to open an account online.
If you are new to futures and options and want to learn more, download the RMB Short Course in Futures and Options. This free, easy-to-read guide covers all the basics. Call us toll-free at 800-345-7026 or 312-373-4970 direct for your free copy or go to our website at www.rmbgroup.com. Click the “Education Tools” tab at the top of the home page and scroll down to find the report.
* * * * * * * *
The RMB Group
222 South Riverside Plaza, Suite 1200, Chicago, IL 60606
This material has been prepared by a sales or trading employee or agent of R.J. O’Brien and is, or is in the nature of, a solicitation. This material is not a research report prepared by R.J. O’Brien’s Research Department. By accepting this communication, you agree that you are an experienced user of the futures markets, capable of making independent trading decisions, and agree that you are not, and will not, rely solely on this communication in making trading decisions.
DISTRIBUTION IN SOME JURISDICTIONS MAY BE PROHIBITED OR RESTRICTED BY LAW. PERSONS IN POSSESSION OF THIS COMMUNICATION INDIRECTLY SHOULD INFORM THEMSELVES ABOUT AND OBSERVE ANY SUCH PROHIBITION OR RESTRICTIONS. TO THE EXTENT THAT YOU HAVE RECEIVED THIS COMMUNICATION INDIRECTLY AND SOLICITATIONS ARE PROHIBITED IN YOUR JURISDICTION WITHOUT REGISTRATION, THE MARKET COMMENTARY IN THIS COMMUNICATION SHOULD NOT BE CONSIDERED A SOLICITATION.
The risk of loss in trading futures and/or options is substantial and each investor and/or trader must consider whether this is a suitable investment. Past performance, whether actual or indicated by simulated historical tests of strategies, is not indicative of future results. Trading advice is based on information taken from trades and statistical services and other sources that R.J. O’Brien believes are reliable. We do not guarantee that such information is accurate or complete and it should not be relied upon as such. Trading advice reflects our good faith judgment at a specific time and is subject to change without notice. There is no guarantee that the advice we give will result in profitable trades.
This report was written by Investors Publishing Services, Inc. (IPS). © Copyright 2017 Investors Publishing Services, Inc. All rights reserved. The opinions contained herein do not necessarily reflect the views of any individual or other organization. Material was gathered from sources believed to be reliable; however no guarantee to its accuracy is made. The editors of this report, separate and apart from their work with IPS, are registered commodity account executives with R.J. O’Brien. R.J. O’Brien neither endorses nor assumes any responsibility for the trading advice contained therein. Privacy policy is available on request.