Futures Outlook: 06/18/13
Revisiting Crude Oil and Watching 100
Last time I wrote on the topic of Crude Oil we had watched for and seen a nice head and shoulders pattern develop and do better than completion. As mentioned “Crude Oil has not only completed but exceeded the completion level for the head and shoulders pattern that was developing last week and in so doing has tested below our $90 mark.” Crude Oil never was able to get lower than the 80’s which was mentioned as our next support level and has now rebounded nicely. At this point, all eyes should be on 100.
Crude Oil
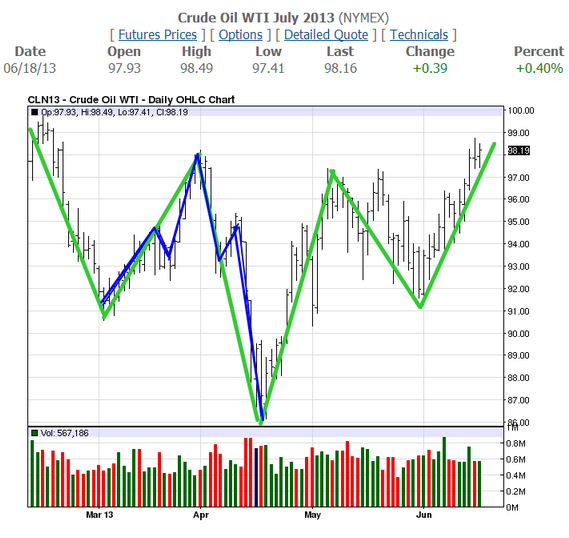
On today’s Daily chart for crude oil, I have highlighted in blue, the original head and shoulders pattern that we wanted to see develop which performed even better than expected. I have also highlighted in green an even larger inverse head and shoulders which has almost completed itself now. Please note that the “sticking point” here is once again going to be the psychological and resistance level of 100.
Per the Daily chart, we may be a little overextended right now, but if a bit of retracement is allowed and comes through, then Crude Oil might have an excellent chance of breaking that 100 territory. Remember though, we have been here before.
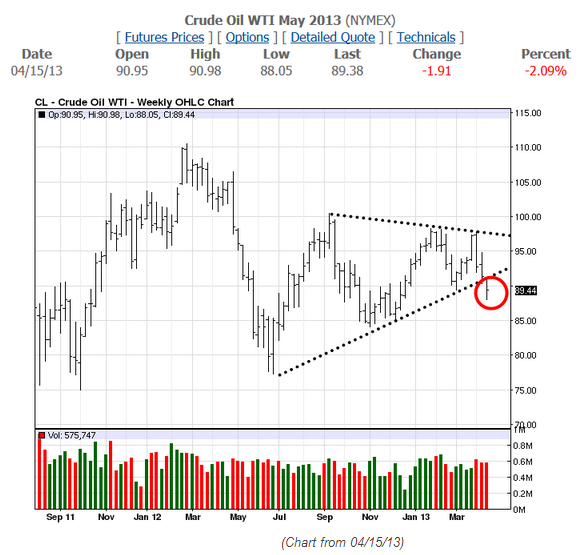
(Chart from 04/15/13)
Per this Weekly chart featured in my last article on Crude Oil, I mentioned that the break of the line in our pattern could potentially be a head fake and it turns out that it was.
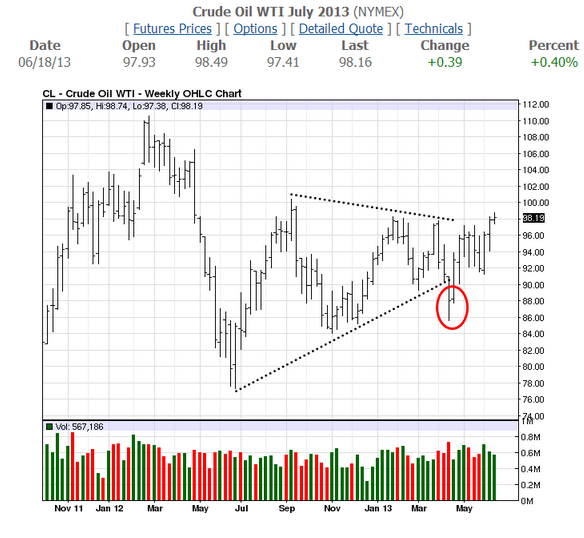
This is the way that Weekly chart looks today. You can see that we did test the lower boundaries, but then brought the price point action right back up with ascending pressure building.
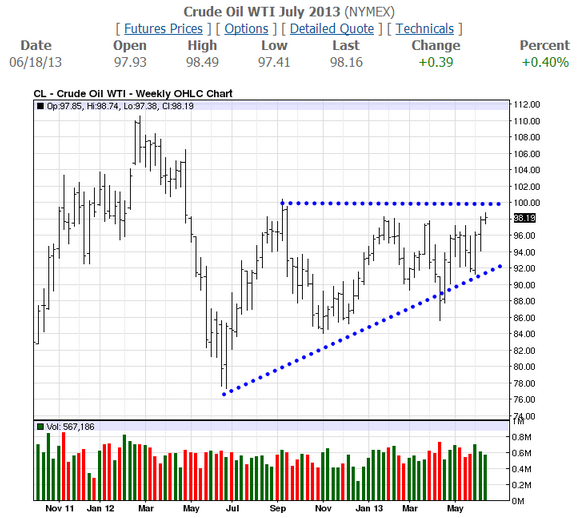
I look at it now more in the light of an ascending triangle with 100 clearly being the number to beat. A test above 100 will not be enough however, Crude Oil needs to build the energy or have an impetus to make a real run through 100.
When moving into the Monthly chart, our larger pennant type formation that we have been watching for months now, still holds.
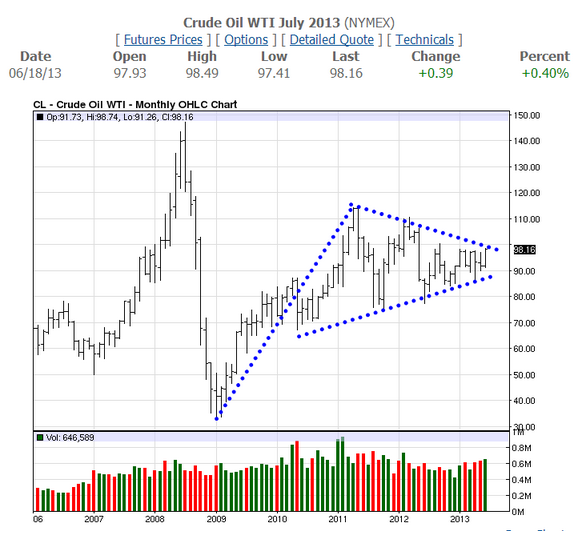
At this time, we are poised well to see a test and potentially a break of the 100 territory. Remember however, that we have played with this level many times over the last few years. The pattern that has been built on the Monthly chart speaks of the potential for a significant move whenever the pattern truly breaks and as it has been tightening up, we seem closer now than we have been in the last few years. Pay close attention to this daily as momentum should be your guide and you will be able to watch it first and closest via your Daily charts.
We have a strategy that allows you to add Crude Oil to your portfolio via a longer term options spread with fixed risk and a lower capital outlay than many other investment vehicles. If you would like to prepare yourself for Crude Oil’s next move, then please contact us directly.
For more information or for daily assistance with the Options market on Commodities and Futures, visit www.rmbgroup.com or click here to get started today.
This material has been prepared by a sales or trading employee or agent of R.J. O’Brien and is, or is in the nature of, a solicitation. This material is not a research report prepared by R.J. O’Brien’s Research Department. By accepting this communication, you agree that you are an experienced user of the futures markets, capable of making independent trading decisions, and agree that you are not, and will not, rely solely on this communication in making trading decisions.
DISTRIBUTION IN SOME JURISDICTIONS MAY BE PROHIBITED OR RESTRICTED BY LAW. PERSONS IN POSSESSION OF THIS COMMUNICATION INDIRECTLY SHOULD INFORM THEMSELVES ABOUT AND OBSERVE ANY SUCH PROHIBITION OR RESTRICTIONS. TO THE EXTENT THAT YOU HAVE RECEIVED THIS COMMUNICATION INDIRECTLY AND SOLICITATIONS ARE PROHIBITED IN YOUR JURISDICTION WITHOUT REGISTRATION, THE MARKET COMMENTARY IN THIS COMMUNICATION SHOULD NOT BE CONSIDERED A SOLICITATION.
The risk of loss in trading futures and/or options is substantial and each investor and/or trader must consider whether this is a suitable investment. Past performance, whether actual or indicated by simulated historical tests of strategies, is not indicative of future results. Trading advice is based on information taken from trades and statistical services and other sources that R.J. O’Brien believes are reliable. We do not guarantee that such information is accurate or complete and it should not be relied upon as such. Trading advice reflects our good faith judgment at a specific time and is subject to change without notice. There is no guarantee that the advice we give will result in profitable trades.