Today, I wanted to visit the grain complex again. This time, the focus will be on Oats and I will be looking at the December contracts due to the greater participation levels in that contract month.
Oats
When evaluating oats on the Daily chart, there is some interesting activity.
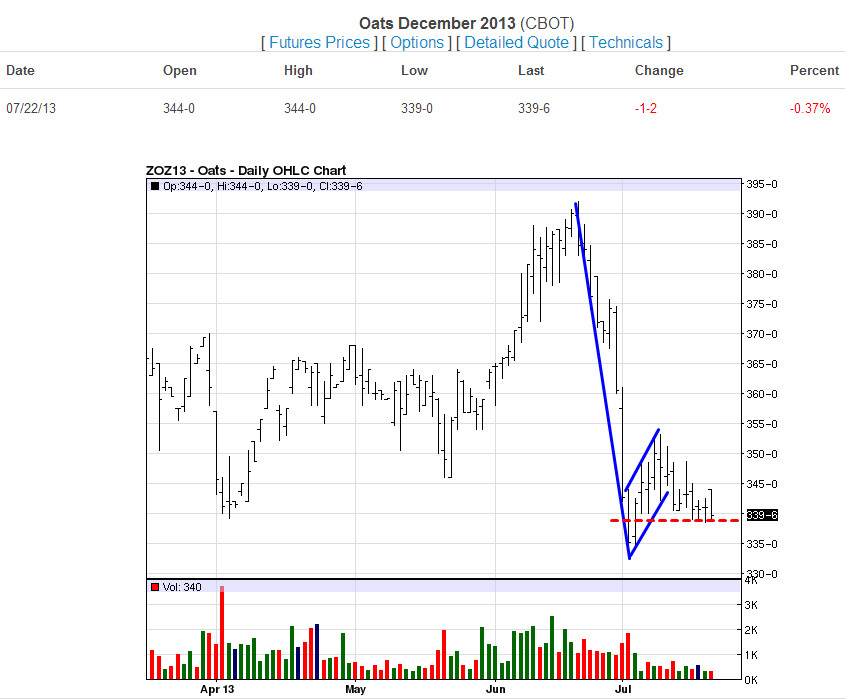
I have highlighted what was a pretty significant bear flag on the Daily chart here in blue. An overextended rally on the days caused a correction that was not any ordinary correction, but rather a reversal. Oats formed this bear flag and have been in the process of recovering lower ground beneath the highs of the flag. Today, however, it looks as if we are in a bit of a stalemate. Watch Oats closely for a breakout above 345 or so for very tight time frame bullish behavior, but understand that if you are bullish on Oats 370 is really the number to beat in order to re-establish any true strength. If you are keen on paying attention to this latest bearish move, then you will want to keep an eye for a breakout to the short side below 335. I would start paying attention a little bit sooner than that. Start to watch should Oats break 337 as it may be indicative of the next slide.
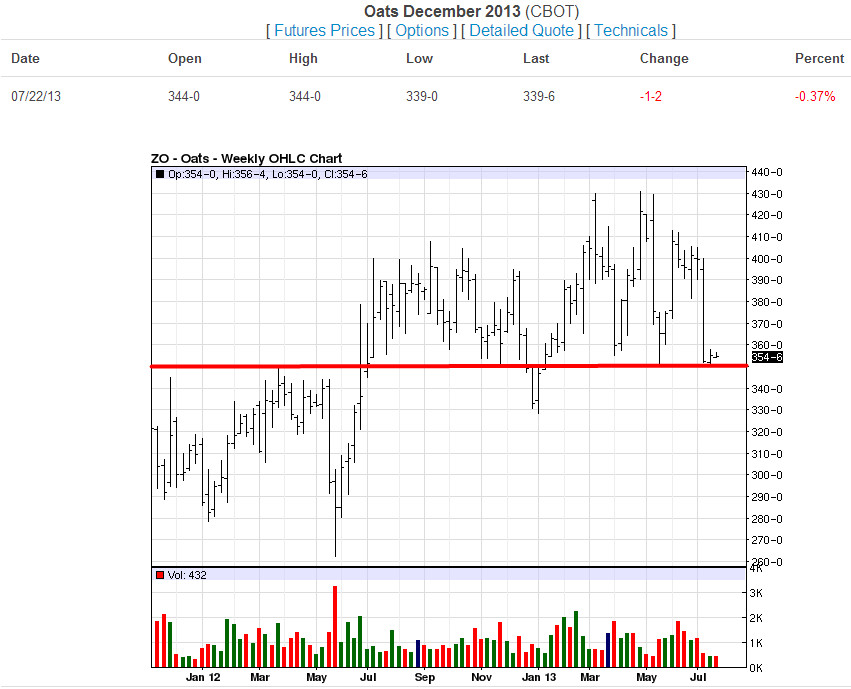
When we arrive at the Weekly chart, we gain some additional perspective. I have only highlighted one thing on this chart and it is the 350 territory. From a more intermediate time frame and trading viewpoint, the 350 territory is make it or break it. This level has been used over and over again as both resistance and support. The amount of force that we saw in the fail from 400 down to the 350 territory at the end of June and into July is indeed impressive. From the Weekly perspective, this was a straight shot lower without any real pit stops. It will be important to watch and see what happens next. For me, because of the velocity of this latest move, I tend to favor the short side for Oats. Right now, per the day to day activity, we are sidewinding a bit. The breakout on the Daily chart will be an important factor for establishing purpose here on the Weekly chart and the intermediate viewpoint.
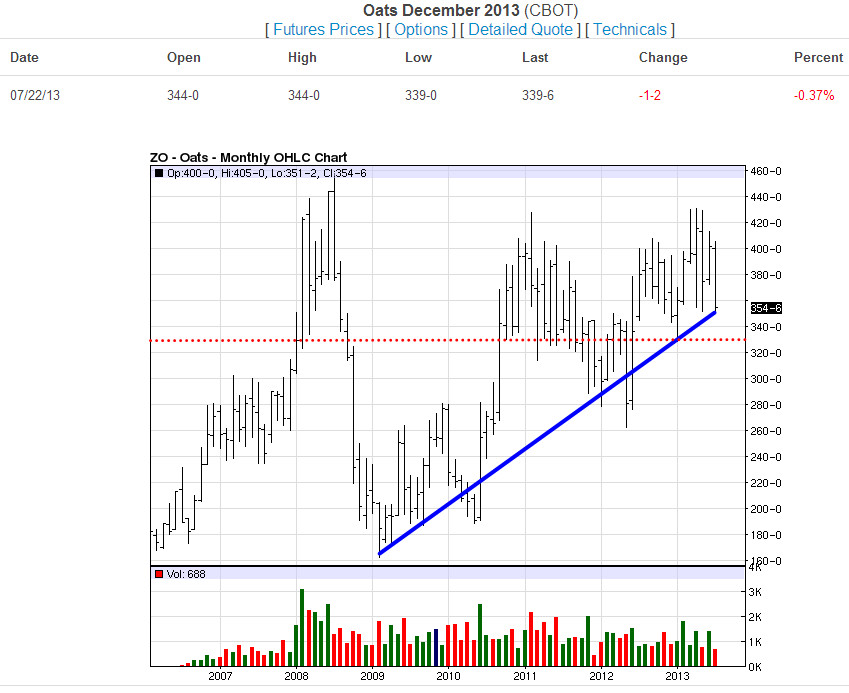
The Monthly chart brings us out to a much broader perspective. Here, I have highlighted in blue the basic trendline for the last four years. We have moved upwards with some corrections along the way, sometimes even head faking outside of expected boundaries. This trend, in my view, has been extremely strong for the duration and my very well be in need of a bigger correction. Now I’m not saying that Oats are going to 200, but a break to the down side from a larger picture perspective would be healthy. One of the main turning points or observation points will be the 350 that I mentioned and highlighted on the Weekly chart. I have highlighted it here as well with a dotted red line. This will be an important territory to watch. Should Oats start to move lower and challenge the 350, you will need to be aware of the head fake potential. However, a solid break of 350 could turn into a very nice correction and potentially a trend reversal on a chart that needs it.
If any of you would like to participate in a move on Oats, but counter trend trades make you nervous, you should know that you don’t have to assign a lot of capital or a significant amount of risk. You might actually consider using options to allocate lesser capital in a fixed risk scenario. That would allow you to bet on the farm without betting the farm.
For more information or for daily assistance contact us or call 1-800-345-7026.