Poor gold bugs…Their belief in the yellow metal never seems to die. Not even a punishing bear market, which clipped over 40% from gold’s August 2011 high, has dented their enthusiasm. They chalk up the past 3½ years to “manipulation” by big banks and other futures traders on the Comex. And they point to the increasing Asian appetite for the yellow metal as proof that prices should be higher – much higher in fact – if only “evil” speculators would get out of the way. If you’ve subscribed to any gold-centric publication in the past few years, you’ve seen this argument many times. Too bad it hasn’t worked.
Like a broken clock, we believe die-hard gold bulls may eventually be right – but not for the reasons they cite. Asian buying will not be the fuel powering the next leg up in gold. Nor will inflation. We believe the future price of gold will be determined by interest rates.
The lower interest rates go, the more attractive gold will be for those seeking safety because they will be sacrificing less. Not only does gold pay no interest, it actually costs money to hold. With rates approaching zero in much of the world – and in the case of German 5-Year notes, going negative – gold becomes more attractive almost by definition.
The chart below shows this relationship:
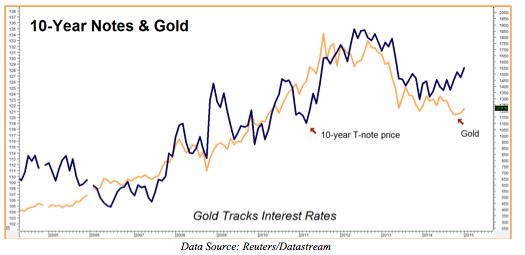
The price of 10-year US Treasury notes move opposite interest rates: the higher the price, the lower the interest rate and vice versa. When the blue line in the chart above is rising, interest rates are falling. Note how closely this correlates to movements in the price of gold (gold line). The relationship is fluid – sometimes T-notes lead and sometimes gold leads, but eventually they both adjust and begin moving in the same direction. Divergences don’t last very long.
As the chart above illustrates, T-note prices are currently rising (and interest rates falling) much faster than gold prices. It makes sense to assume that either: 1) T-note prices are too high and interest rates too low, 2) gold is too low, or 3) a combination of both. The last two peaks in the price of gold occurred a few months before and a few months after the all- time low in 10-Year Treasury yields. We believe gold could surprise even the gold bugs and test old highs just above $1,900 per ounce if US 10-Year yields continue their current freefall.
Of course, the anomaly could be T-Notes. We are examining this market and looking for a relatively low-risk trade to cover the possibility of higher interest rates that we can mate with our bullish gold position. We’ll have more on this shortly…so stay tuned.
Gold Uptrend Still Intact Long Term
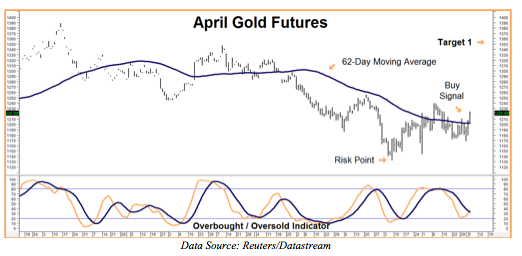
The daily chart (below) shows gold attempting to establish a base with a series of higher highs and higher lows. Two consecutively higher closes over the old swing highs of $1,238 in the April contract would confirm a completion of this base. This sets the stage for a push higher, making the next stop $1,350 per ounce. This is our first upside target.
This is a very tradable set up. Two consecutive, higher closes over the previous day’s high gave us a buy signal yesterday. Not only do we have a fabulous entry point, we have a solid risk point as well. Two consecutively-lower closes below old lows at $1,132 per ounce would negate the potentially bullish scenario we’ve described. We would recommend exiting all bullish positions if it occurs.
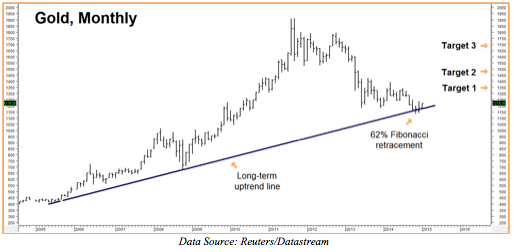
How low gold drops once its long-term uptrend is negated remains open to debate, but we would not be surprised to see the Midas metal retest $1,000, and maybe even $720 per ounce, once $1,132 is forcefully taken out to the downside. There is potentially good news for bulls however: gold could trade as high as $1,462 (“Target 2” on monthly chart above) and perhaps even $1,680 (“Target 3”) should global interest rates continue their freefall.
Is it finally time to buy gold? We say “Yes!” – but cautiously – which is why we use options to make our play.
What to Do Now
We recommend that RMB Group trading customers consider buying April bull call spreads targeting $1,350 per ounce in the April futures contract. The spreads we are looking at are currently going for approximately $600. This plus transaction cost is our maximum risk. Our potential gain is $5,000 per spread should gold hit our $1,350 objective on or prior to option expiration on March 26.
Prices can and do change so check with your personal RMB Group broker for the latest on this strategy and to get up-to-the-minute pricing.
If you don’t have an RMB Group trading account and would like to know more about this or any other “Big Move” strategy, call 800-345-7026 toll free or 312-373-4970 direct. You can also email suerutsen@rmbgroup.com or visit us online at www.rmbgroup.com.