Ghosts and goblins won’t be the only scary creatures roaming the globe this Halloween. The monster lurking within financial bowels of Japan won’t disappear any time soon. With a debt to GDP ratio of 250% and debt load 25 times annual revenue, the fiscal nightmare haunting the “Land of the Rising Sun” will still be around well after November 1. Holders of both yen and Japanese government debt should be afraid – very afraid.
As the title of our recent RMB Special Report suggests, Japan is an accident just waiting to happen. (To learn more about the economic fundamentals troubling this nation click here to get that report.) In today’s post we are going examine the yen from a chart-based (technical) perspective. In our view, the technical outlook is no less frightening.
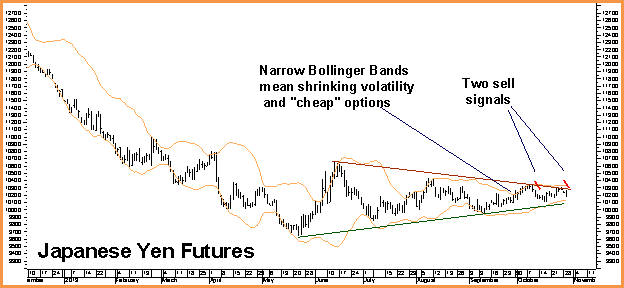
Let’s start with the daily chart. The yen has been the weakest currency versus the dollar for some time now, barely managing to stay flat while the euro, Aussie and Swiss franc have soared. This sideways action has accomplished two important things: 1) It has alleviated the long term oversold condition of the market caused by the yen’s 2012 swoon and 2) removed a whole bunch of volatility from the market, causing the premiums of the yen options to drop substantially.
Since there is no way that Japan can solve its debt problems without a weaker yen – at least in our opinion – we’ve been patiently waiting for an opportunity to add to our longer-term, bearish position in this market. We think we finally have it.
Yesterday’s close was the second time in the past two weeks that the Japanese currency was able to
close twice consecutively below a previous day’s low. This indicates weakness and increases the potential of a downside breakout of the yen’s extended sideways pattern. If this breakout does occur, volatility will spike rapidly making Japanese yen puts not so “cheap” anymore. That’s why we want to add to our bearish position now.
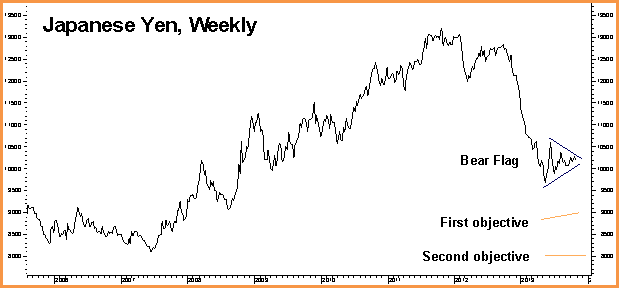
The weekly chart above shows the yen from a longer-term perspective. The 5-month consolidation pattern that takes up most of the room in the daily chart can be easily identified as a potential bear flag. A downside breakout from this formation could send the Japanese currency to .09000 from current levels of .10200 in relatively short order. We want to be on board if and when this occurs.
Suggested Action – buy June 2014 puts and/or bear put spreads in the yen: Right now we are looking at spending roughly $1,250 (plus transaction costs) for a straight put play that will be worth at least $7,500 should the yen hit our target prior to option expiration in early June 2014.
The net amount we spend for our puts will be the most we have at risk. Bear spreads will cost less – in some cases substantially less–but won’t gain or lose value as quickly as outright puts.
Contact your RMB broker for specific, real-time recommendations.