The traditional Chinese curse “May you live in interesting times” pretty much sums up what we expect for the next 12 months. The US stock market already built in the “best of all possible” outcomes for a Trump Presidency – including massive tax and regulatory relief and a huge fiscal stimulus. When reality sets in on January 20th, President Trump and the GOP Congress are going to have to find a way to finesse very difficult budget choices.
The problem is the math. The new President will find it nearly impossible to keep all the promises made during the campaign without blowing a huge hole in the budget. The billions for the wall? It turns out Mexico is not going to pay for it after all. More importantly, the hundreds of billions promised for new defense and infrastructure spending are going to be even harder to come by with the big tax cuts touted by President-Elect Trump – at least, without a huge hit to the budget. This will be hard to square with budget hawks in the GOP-dominated Congress.
The Trump tax cuts will need to be scaled back, proposed infrastructure spending will need to be curtailed, or a little bit of both. Our guess is tax cuts will be favored over infrastructure spending because the former is part of an ideology shared by the party in power. Non-defense government spending is enemy number one for the fiscally conservative wing of the Republican Party. This could curtail a big infrastructure bill. An improving economy could be another reason to go slow.
This means that the billions in fiscal stimulus the US stock and bond markets have already priced in will probably not be forthcoming any time soon. There will be a lot of talk about how to incentivize private money to make infrastructure investments in the form of toll roads and other fee-for-use projects, but these investments – if they materialize at all — will likely be billions short of what the market is expecting, and years before they get off the ground.
“Certainty” Is Nearly Always an Illusion
While we are not predicting an imminent collapse, we are acutely aware that the “certainty” markets seem to be looking for is nearly always elusive. Things tend to change at the point when the overwhelming bulk of investors expect the opposite. Virtually no one thought markets would soar in the event of a Trump win – but they did. Now that most of the same people believe GOP control of all three branches of government will be good for markets, we believe it is time for caution.
In fact, we expect 2017 to be such an “interesting” year, that we are not making any predictions as far as stocks go – at least not yet. We are, however, very skeptical that the rosy, business-friendly scenario currently built into the markets, and shared by nearly all the talking heads on CNBC and Fox Business News, will be enough to power current trends more than 3 or 4 months into the new year.
We’ve featured the two charts below before, but they deserve another look now – especially given the enthusiasm the stock market has exhibited since election night.
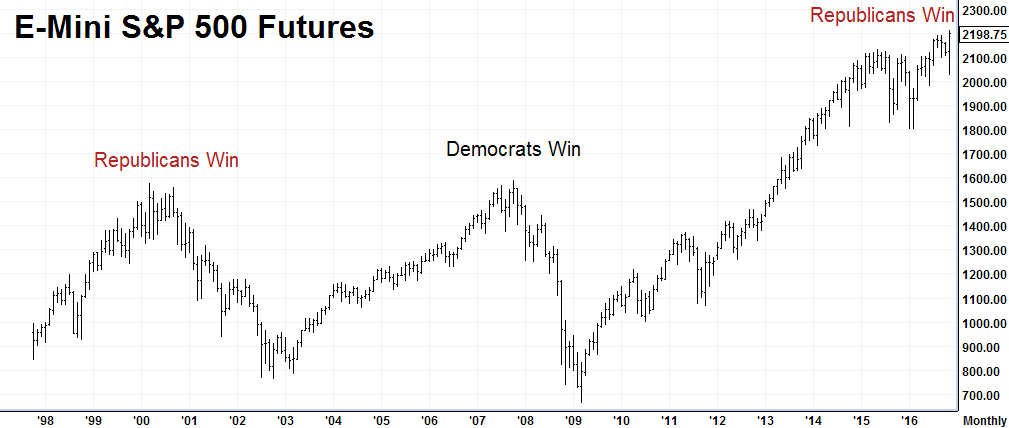
Data Source: FutureSource
As we’ve noted in past blogs, stocks have a tendency to decline during changes in party following an eight-year presidential term. The timing can vary slightly, but political change does not come cheap. As the chart above illustrates, stocks skyrocketed to new highs in the February following the 2000 election of George W. Bush. It took nearly the rest of his presidency for the market to make it back to that level.
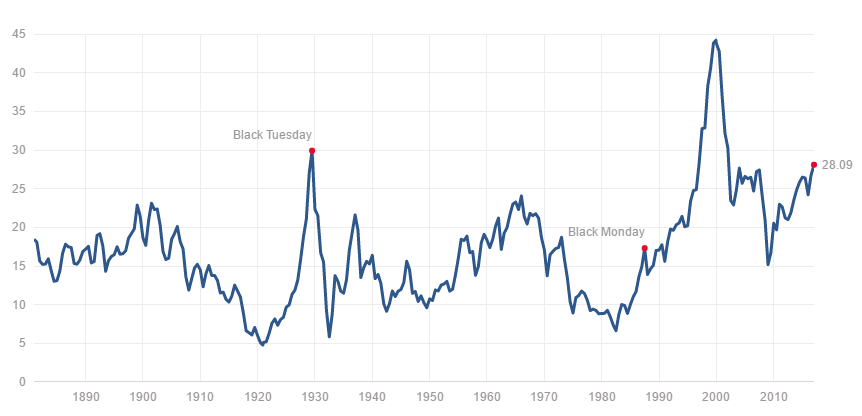
Source: Mutpl.com
Our next chart shows the Shiller PE index and illustrates just how overvalued stocks were at the beginning of the presidency of George W, hitting a PE of 43. Today’s market is rapidly approaching the 30 level that preceded the 1929 crash which occurred – coincidentally enough — during the first year of the Herbert Hoover presidency. We are back in nosebleed territory now.
Who was the last pure business tycoon elected president of the United States before Donald Trump? Herbert Hoover. The stock market soared after Hoover’s election in anticipation that he would bring no-nonsense business experience to Washington. Sound familiar?
Herbert Hoover is remembered by history as one of the worst American Presidents, but it might not have been all his fault. Like George W. Bush, Mr. Hoover’s biggest misfortune may be the accident of being elected at the tail end of a long and powerful bull market.
Here’s what Greg Ip of The Wall Street Journal (WSJ 1/4/2017) has to say about the Hoover / Trump connection:
“…few presidents entered office with a better business resume than Herbert Hoover. He’d made his fortune in mining and his reputation managing war relief and as commerce secretary.”
“The stock rally that greeted his election in 1928 was the last to rival Mr. Trump’s. His postelection stock rally is among the strongest on record.”
“Yet Mr. Hoover couldn’t stop the Depression, in part because he sought purely private-sector solutions to problems that needed government intervention.”
“If his rally is going to have a happier ending than Mr. Hoover’s, Mr. Trump should ensure he seeks economic advice from outside the board room.”
Will a President Trump be undone by the accident of coming to power at the top of a market cycle? At almost 94 months, the current rally is the second longest on record, exceeded only by the 113-month Bill Clinton rally that George W. Bush inherited. Investors need to ask themselves if the potential upside of a continuation of the current rally is worth the risk of potential losses should any of the multiple, bullish expectations currently built into the market fail to materialize.
Are we predicting a Hoover-like crash in 2017? Not necessarily. Stocks could continue to make new highs, eventually triggering the billions in cash sitting on the sidelines to enter the market in a massive FOMO (fear of missing out) capitulation rally. Stocks could also continue to struggle against DOW 20,000 and fail miserably. The bottom line is: nobody knows what is going to happen. We believe the odds favor the cautious.
Bond Bull Market Is Probably Over
Bonds have already had a huge decline, wiping out well over a trillion dollars in net asset value and potentially signaling the beginning of a new multi-year bear market which could have impacts far more damaging than a decline in stocks. The global bond market is larger than the global stock market. It is also the home of the world’s “safe” money. Lower bond prices increase interest costs. This redirects capital that could be harnessed to start new businesses and create new jobs into debt service. It leaves governments with less cash to meet their ongoing expenses of governing, sharply increasing deficits and national debt.
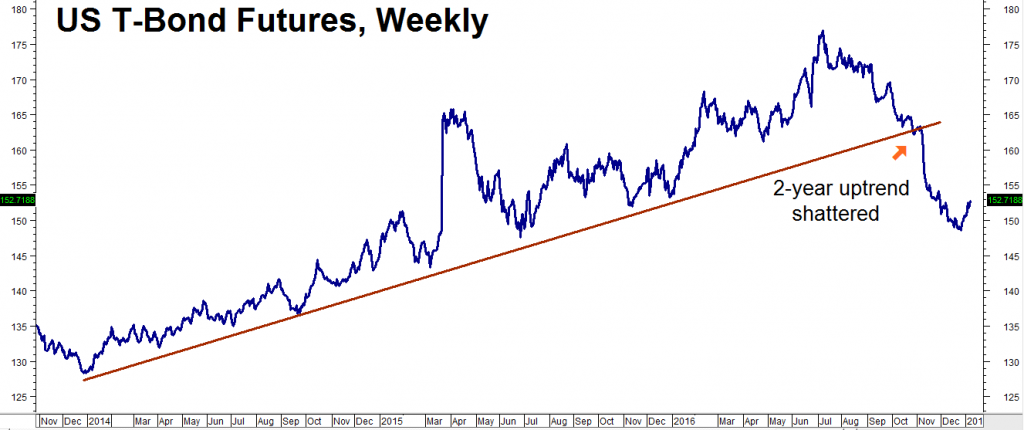
Data Source: Reuters/Datastream
Falling bond prices and higher interest rates also threaten the current bull market in stocks. Get long-term interest rates far enough above the rate of inflation – let’s say above 3% on the 10-year and 4% on the 30-year – and a boatload of cash could steam right out of stocks and back into bonds.
What could stem the decline in bonds? There are a number of possibilities, but here are three key ones to consider:
- Failure to pass a government-funded infrastructure bill – both stocks and bonds have already priced in the multi-billion dollar infrastructure stimulus plan promised by President-Elect Trump. With 9 days to go until inauguration, we’ve heard a lot about repealing Obamacare but nearly nothing about fiscal stimulus. Infrastructure spending needs to happen fairly fast or the markets will begin pricing it out.
- Global recession caused by potential blow-ups in China and Europe – the 2nd and 3rd largest economies in the world are facing many challenges – too many to list here. China’s challenge is making the shift from an export economy to a consumption economy. There are numerous obstacles in the way. Right now the biggest problem is the weak yuan. Moneyed Chinese are scrambling to convert their cash into dollars and move it out of the country – sapping the treasury of funds needed to make the transition to a more mature consumption-based economy.
In Europe, a slew of elections due to take place in 2017 plus the potential for bank failures in Italy –Europe’s third largest economy – could coalesce, causing big problems for Europe and, by extension, the entire globe.
- A 1930s-like Trade War – this is our biggest fear. There is no question that there is a huge backlash against globalization in the US and Europe. Tariffs appear to be back in vogue. Stock markets hate trade wars. So does nearly every economy. The Great Depression was significantly worsened by the infamous Smoot Hawley Tariff Act. Trade wars can also lead to real wars – as witnessed by the history of that period. World War II was partially fueled by the 1930s trade war. Real wars are not good for anyone.
Beware of Crowded Trades
Higher interest rates in the US make the dollar more attractive. Not surprisingly, the US dollar has been one of the stellar performers of 2016. Expectation that the Fed will continue to tighten, with perhaps three to four more increases this year, have kept a bid under the greenback.
Short bonds, long stocks, long crude oil, and long dollar have been the dominant themes of 2016. Nearly every forecast we’ve read for 2017 assumes these themes will continue to dominate in 2017. The problem is, virtually all these trades are crowded. It has become nearly impossible to make an argument against the underlying fundamentals driving these markets. That’s why we believe every trend follower is probably already in them.
Could 10-year note yields hit 3% in the first quarter? Certainly. Will the US dollar hit parity? Probably. Will the Dow blow through 20,000? Maybe. But that doesn’t necessarily mean investors should bet all their chips on them. When the entire financial community seems to agree on any given outcome, it’s time to question it.
Speculators looking for opportunities with better reward-to-risk characteristics may be better off looking elsewhere. We’ll be exploring some of these opportunities for our active trading customers in an “RMB Big Move Trade Alert” to be published shortly.
Diversification Is Critical to Survive “Interesting Times”
For less active traders, the key to surviving “interesting times” is diversification among asset classes. Having exposure to multiple asset classes, such as commodities, currencies and precious metals, can help cushion unexpected surprises. Being able to effortlessly “go short” any asset class – including stocks and bonds – is also critical.
Adding Managed Futures to your portfolio can give you upside and downside exposure to nearly every asset class – including the ability to “go short.” This helps provide critical diversification during “interesting times.” Couple this with expert management backed by audited track records, and it is easy to see why Managed Futures are a key component of professional money manager portfolios – be it pension funds, university endowments or family offices.
To learn more about this powerful asset class, visit our website at www.rmbgroup.com and download our free booklet “Opportunities Outside the Stock Market.”
Sample Portfolio Update
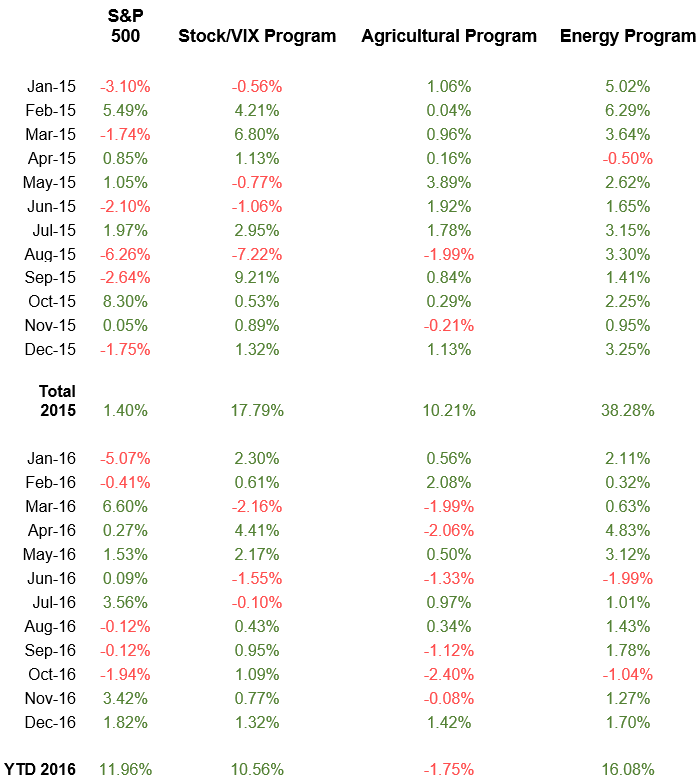
We introduced the table below in September 2016. It shows the performance of three Managed Futures programs we are following versus the S&P 500. The first specializes in trading stock market volatility and global stock indexes. The second trades agricultural commodities, and the third focuses on energy. We will update this periodically so our customers have a real-world, dynamic picture of diversification in action.
The 24-month time period of this example may not be enough to take to the bank, but it is enough to show how each program performed over different market conditions, including bull, bear, and sideways markets. (Note: We have not supplied the name of these programs, because we do not want anyone to enter them based solely on performance shown here.)
Three Managed Futures Programs vs the S&P 500
Investors should consider adding managed futures to their investment portfolios only after carefully reviewing the Disclosure Documents of each CTA they are interested in. A Disclosure Document is to Managed Futures what a prospectus is to stocks. It includes the background, trading style and experience of traders running the program. It also lists risk factors and other information, including the minimum account size each program will accept along with audited track records for the trader or traders running the program or programs.
To find out more about the Managed Futures programs we are currently following – or to get more information on Managed Futures in general, give us a call toll-free at 800-345-7026 or 312-373-4970 direct. You can also visit our website at www.rmbgroup.com.
—
The RMB Group
222 South Riverside Plaza, Suite 1200, Chicago, IL 60606
This material has been prepared by a sales or trading employee or agent of R.J. O’Brien and is, or is in the nature of, a solicitation. This material is not a research report prepared by R.J. O’Brien’s Research Department. By accepting this communication, you agree that you are an experienced user of the futures markets, capable of making independent trading decisions, and agree that you are not, and will not, rely solely on this communication in making trading decisions.
DISTRIBUTION IN SOME JURISDICTIONS MAY BE PROHIBITED OR RESTRICTED BY LAW. PERSONS IN POSSESSION OF THIS COMMUNICATION INDIRECTLY SHOULD INFORM THEMSELVES ABOUT AND OBSERVE ANY SUCH PROHIBITION OR RESTRICTIONS. TO THE EXTENT THAT YOU HAVE RECEIVED THIS COMMUNICATION INDIRECTLY AND SOLICITATIONS ARE PROHIBITED IN YOUR JURISDICTION WITHOUT REGISTRATION, THE MARKET COMMENTARY IN THIS COMMUNICATION SHOULD NOT BE CONSIDERED A SOLICITATION.
The risk of loss in trading futures and/or options is substantial and each investor and/or trader must consider whether this is a suitable investment. Past performance, whether actual or indicated by simulated historical tests of strategies, is not indicative of future results. Trading advice is based on information taken from trades and statistical services and other sources that R.J. O’Brien believes are reliable. We do not guarantee that such information is accurate or complete and it should not be relied upon as such. Trading advice reflects our good faith judgment at a specific time and is subject to change without notice. There is no guarantee that the advice we give will result in profitable trades.
This report was written by Investors Publishing Services, Inc. (IPS). © Copyright 2016 Investors Publishing Services, Inc. All rights reserved. The opinions contained herein do not necessarily reflect the views of any individual or other organization. Material was gathered from sources believed to be reliable; however no guarantee to its accuracy is made. The editors of this report, separate and apart from their work with IPS, are registered commodity account executives with R.J. O’Brien. R.J. O’Brien neither endorses nor assumes any responsibility for the trading advice contained therein. Privacy policy is available on request.