Interest rates measure the price of money. That makes them the world’s ultimate commodity. Like most commodities, the price of money has been falling for a long time. The yield on T-year Treasury notes topped out at 15.32% in September 1981 and began a 35-year decline, dropping as low as 1.50% in July 2016. If you were born after 1965, you have never experienced a rising rate environment during your adult years. This spans two generations of investors – including most traders on Wall Street.
Modern portfolio theory relies heavily on bonds to “balance” stocks and other asset classes with the goal of reducing overall risk. But what if bonds are riskier than accounted for? When yields rise, bond prices drop. This is not a problem in a falling rate environment because bond prices rise when rates fall. Packing a portfolio with bonds has been a winning strategy. Like a ticking time bomb hidden in plain sight, the bonds in your portfolio have the potential to cause major damage in a rising rate environment.
Ten Year T-note Yield
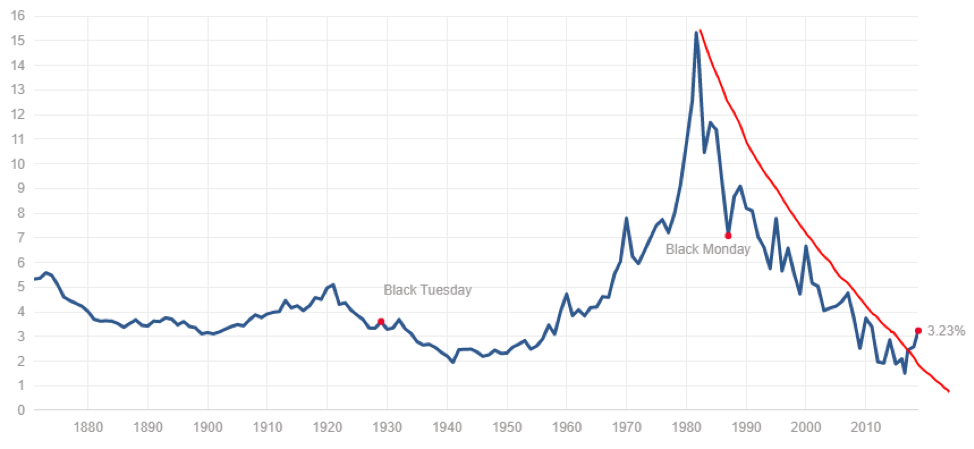
Source: Mutlpl.com
Treasury Yields Have Doubled in Just Two Years
The chart above shows the price of money rising substantially for the first time since the end of the century. In early October 2018, the yield on Ten Year Treasuries reached 3.23% — more than double their July 2016 lows of 1.50%. This move appears to have negated a powerful 37-year downtrend. A continuation of this uptrend in yields would completely upend decades-long assumptions by nearly every single investor.
How much higher can T-bond and T-note yields climb? Both are still historically low. As the chart above illustrates, they are lower than during the early years of the Great Depression. We believe T-bond and T-note yields can go high enough to trigger another big downturn in global stock markets and the global economy.
Rates have been falling for so long that a continuation of today’s low rate environment is already baked into the economic cake. Falling interest rates have allowed business, government and individuals to retire old debt by taking on new, cheaper debt. In many cases, low rates were artificially imposed by central banks eager to pump cash into the global economy in search of inflation. This inflation was necessary for the fractional reserve banking system (which runs the entire global economy) to survive.
Deflationary Forces Are Waning
For years central banks have been thwarted in their quest to create inflation by factors beyond their control. Globalization and cheap transportation resulting from the containerization of cargo meant goods could be sourced from anywhere in the world. Cheap labor in Asia and elsewhere not only kept a lid on price inflation, it helped drive prices lower. So did the rise of a free and open internet.
Deflationary forces in the global economy became so strong that governments resorted to negative interest rates in an attempt to generate inflation. Investors were willing to pay money to governments for the privilege of holding their money – betting that other investors would be willing to pay more in the future. Negative rates still exist in certain countries in Europe, but the world’s central banks appear to have finally gotten what they’ve been looking for. Inflation is back. Deflation is on the run.
Inflation Is Back
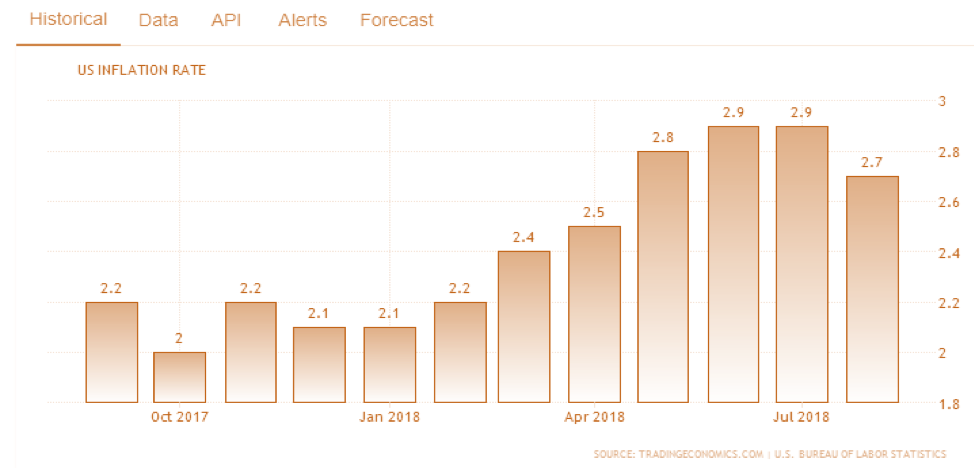
This is particularly true in the United States, the globe’s largest economy. Decades of monetary stimulus did little to juice inflation until the Trump Tax cut. This additional fiscal stimulus has boosted inflation far above the Fed’s 2 percent target rate. The Fed has reacted by tightening policy. The market has already priced in a full percent (100 basis point) jump in short-term interest rates for all of 2018. But the Trump tax cut is not the only inflationary development.
Tariffs Could Trigger Stagflation
Tariffs increase the prices of goods, no matter who makes them, which means they are potential sources of inflation. Adding tariffs to imported steel enables domestic manufacturers to raise prices. This causes the price of anything made with steel to rise as well. Because they are artificially imposed, tariffs can also throw a monkey-wrench into productivity by restricting sources of production to achieve a political rather than economic end.
There are critical parts to many American-made items that are only sourced in China. A prime example is the iPhone. China could make things really difficult for Apple by either raising export duties on these items or banning their export altogether, hurting itself and the US in the process. Why would China do this? To make a political point.
The odds of China resorting to actions like this grow larger the longer the trade war with America lasts. Tariffs hurt everyone – but the US imports a lot more from China than vice versa. Withholding key components is a way for China to retaliate. All is fair in love and war.
Tariffs could also be the source of what many economists consider the worst of all possible scenarios: stagflation. Stagflation is zero economic growth accompanied by high inflation and high interest rates. Like it or not, growth is a function of the global economy. Hinder the latter and you stifle the former. Tariffs are specifically designed to block the efficient transfer of goods.
An extreme case of stagflation is Venezuela, which has spent decades trying to create a “workers’ paradise” and fashioned an economic hell instead. While we are not predicting Venezuelan-like stagflation in the US, stagflation in any form is extremely destructive.
Wage Pressure Is Intensifying
Combine a strong economy with rising prices and you get wage pressure. Employers raise wages to keep employees from jumping ship. Internet retailer Amazon’s recent decision to bump the wages of all its workers to $15 per hour is just the latest symptom of this dynamic.
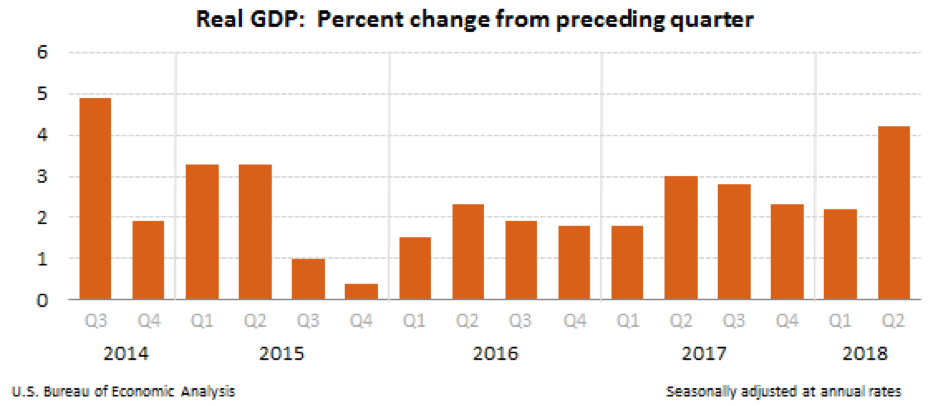
The US economy expanded by 4.1% in the second quarter of 2018 and is expected to maintain a fast pace in the third quarter. Wage pressure should continue for the next few quarters. The Fed will likely keep tapping the brakes and raising interest rates until a major stock market correction caused by higher rates forces them to back off.
Global Debt Hitting New Record
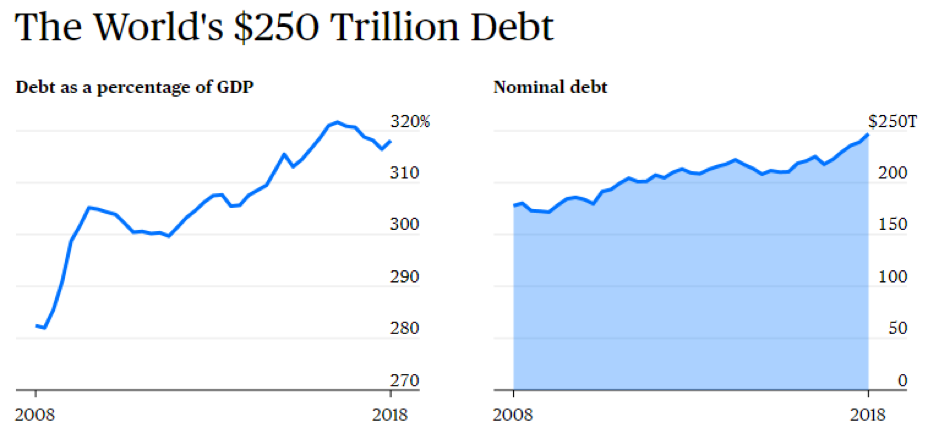
The global debt-load is exploding. The combined amount owed by the nations of the world is now a staggering $247 trillion – with a big “T” – at the end of the second quarter of 2018. As we mentioned earlier, 3½ decades of declining interest rates have allowed businesses, governments and individual to retire existing debt by replacing it with cheaper, new debt. This enables money to stay in the economy, maintaining liquidity and lubricating the wheels of commerce.
A rising interest rate environment makes replacing old debt with new debt impossible. Money to pay off old loans becomes more expensive. Interest payments rise, removing liquidity from the system. It becomes more difficult to exit long positions and increases the odds of default across the board. Panic often ensues.
The more debt owed, the greater the potential impact of any large default. This is precisely what happened in 2008 when Lehman went under. With the current global debt-load now 318% of global GDP, a similar scenario today could prove much more destructive – spreading rapidly into sovereign debt like US Treasury bonds and notes.
Bonds Are Not “Risk Free”
Conditioned by decades of falling interest rates, Americans believe government bonds are “risk free.” But bonds and bond funds are not risk free. Bond prices fall when interest rates rise. Like stocks, bonds can collapse with dizzying speed, especially in inflationary, rising rate environments. Or when the creditworthiness of the issuer is in question. Orders to buy can simply dry up. This creates even more fear as investors scramble to exit their rapidly-deteriorating positions.
The global bond market is estimated to be 30% larger than the global stock markets. There are over 17,000 municipal issues and untold billions in domestic and foreign ETFs/funds and IRAs/Keoghs. For tens of millions of retirees, this is intended to be their primary source of income. We haven’t seen any signs of panic yet, but this could change in a hurry. It won’t be pretty, if and when it happens.
Not long ago, money was pouring into the US from investors fleeing the crisis in Europe and Chinese investors rushing to get their money out of China. Both sources of overseas funds have dried up despite the huge yield advantage US government debt has over its foreign counterparts.
3 More Reasons to Be Wary
- Emerging market currencies are tanking – this creates a huge potential problem for the Treasury market. The Turkish Lira, Brazilian Real and Russian Ruble have been in free fall for a while. A shrinking currency, by definition, buys less. One way to smooth out a decline in one’s currency is to intervene. That means selling dollars and dollar-based assets. Which dollar-based asset do foreign central banks typically have the most of? US Treasuries.
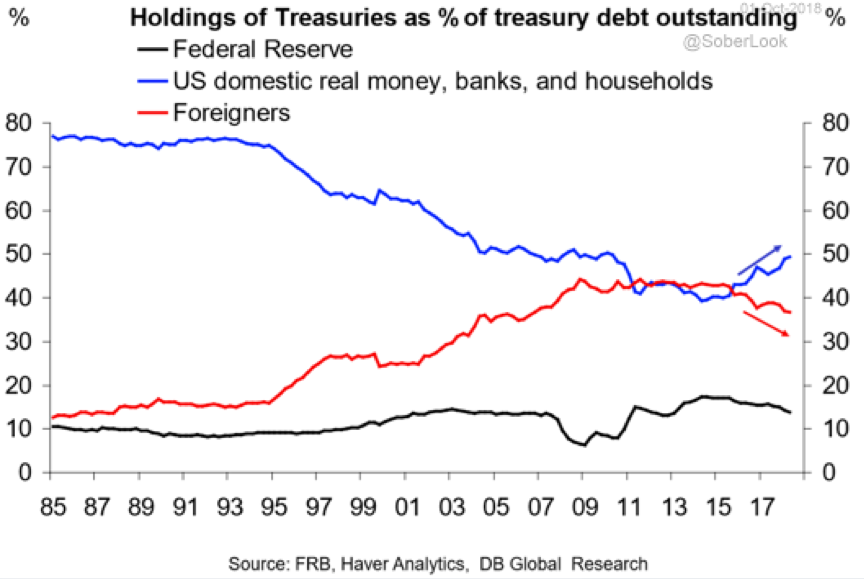
- Foreign nations and the Fed are dumping their bonds – as the chart below illustrates, both foreigners and the Fed are selling treasuries.
- The “smart money” is selling – companies and corporations are falling over one another to issue as much debt as possible to take advantage of investors’ craving for yield. When companies issue debt they sell bonds and notes, putting them on the “short side” of the market.
What to Do Now
T-note prices fall when yields rise. 10-year note yields have skyrocketed from 1.50% to 3.23% in just two years, driving the price of futures contracts down sharply. We believe T-note prices have further to fall and corresponding yields plenty of room to rise. Investors holding Treasuries should be wary.
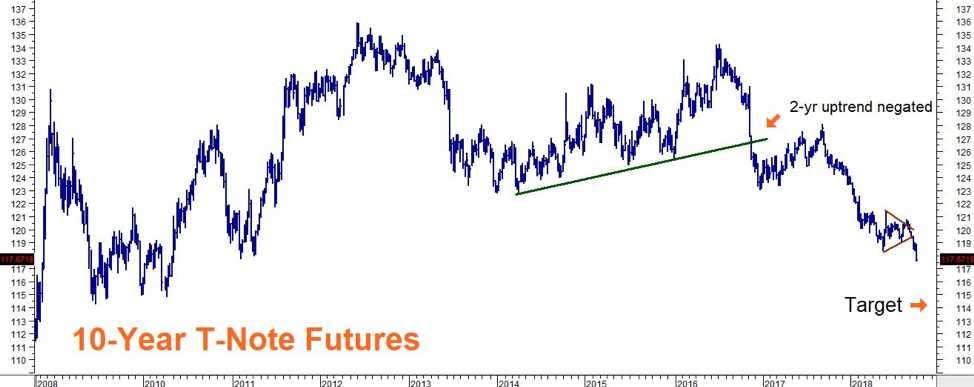
Data Source: Reuters
As the chart above illustrates, the last uptrend in the market was negated following the 2016 election in anticipation of the Trump Administration’s stimulative Fiscal Policy. Prices have broken out to the downside. Prices appear poised to begin a third wave down to our target of 114-00 in the T-note futures contract.
RMB Group trading customers may want to consider using close-to-the-money puts and bear put spreads in the March CBOT-note options to take a short position. Look for yields to continue to rise and T-note prices to continue to fall. Right now, we are looking at buying a March 117 put for $500 or less. This put will be worth at least $3000 should March T-note futures hit our 114-00 objective, on or prior to option expiration, on February 22, 2019.
Call your personal RMB Group broker for specifics, including up-to-the-minute pricing and any changes in strategy. Please be advised that you need a futures account to trade the recommendations outlined in this report.
The RMB Group has been helping its clientele trade futures and options since 1984 and are very familiar with all kinds of option strategies. Call us toll-free at 800-345-7026 or 312-373-4970 (direct) for more information and/or to open a trading account. Or visit our website at www.rmbgroup.com.
* * * * * * * *
The RMB Group
222 South Riverside Plaza, Suite 1200, Chicago, IL 60606
This material has been prepared by a sales or trading employee or agent of R.J. O’Brien & Associates (“RJO”)/RMB Group and is, or is in the nature of, a solicitation. This material is not a research report prepared by a Research Department. By accepting this communication, you agree that you are an experienced user of the futures markets, capable of making independent trading decisions, and agree that you are not, and will not, rely solely on this communication in making trading decisions.
DISTRIBUTION IN SOME JURISDICTIONS MAY BE PROHIBITED OR RESTRICTED BY LAW. PERSONS IN POSSESSION OF THIS COMMUNICATION INDIRECTLY SHOULD INFORM THEMSELVES ABOUT AND OBSERVE ANY SUCH PROHIBITION OR RESTRICTIONS. TO THE EXTENT THAT YOU HAVE RECEIVED THIS COMMUNICATION INDIRECTLY AND SOLICITATIONS ARE PROHIBITED IN YOUR JURISDICTION WITHOUT REGISTRATION, THE MARKET COMMENTARY IN THIS COMMUNICATION SHOULD NOT BE CONSIDERED A SOLICITATION.
The risk of loss in trading futures and/or options is substantial and each investor and/or trader must consider whether this is a suitable investment. Past performance, whether actual or indicated by simulated historical tests of strategies, is not indicative of future results. Trading advice is based on information taken from trades and statistical services and other sources that RJO/RMB believes are reliable. We do not guarantee that such information is accurate or complete and it should not be relied upon as such. Trading advice reflects our good faith judgment at a specific time and is subject to change without notice. There is no guarantee that the advice we give will result in profitable trades.