The public stayed on the sideline for most of the recent 127% rise in the stock market. Now that they’re back in and investing again, is it time for caution? There’s a certain level of fear associated with stock market investing. Equities are considered riskier than bonds and other debt instruments that pay investors a fixed rate of return or “coupon.” Bull markets tend to coincide with healthy levels of skepticism, climbing a “wall of worry.” The current rebound in stocks is no different.
The S&P 500 soared 127% from its March 2009 lows, shrugging off a US downgrade, the near-collapse of Europe, many potentially economy-killing budget stalemates in Washington and a brutal Presidential Election. The US stock market is one of the top 10 global investments of 2012 with the S&P 500 notching gains of 15.75%. Stocks continued their run in 2013. The Russell 2000 (up 8.13%) and the S&P 500 (up 6.65%) were the number 1 and number 2 best global investments of 2013 in the week ending February 22, 2013.
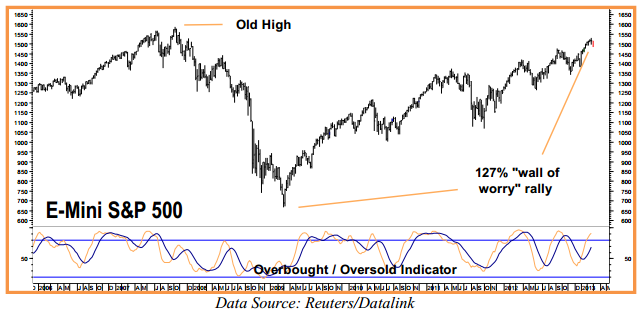
We can’t expect this kind of performance to last forever. At the same time, we don’t want to be frightened out of the market too easily either. Billions of dollars have been left on the table by investors exiting stocks prior to potentially market-moving news. The “fiscal cliff” was a case in point. Investors, who exited prior to or waited until the crisis was resolved to enter the stock market, missed out on one of the best-performing Januarys in recent history.
Stay Long & Reduce Risk
One way to avoid being left on the sidelines during periods of solid stock market performance and not get burned by a surprise collapse is to “hedge” your stock positions by either 1) buying put options covering the value of your portfolio or 2) selling futures contracts. The problem is put option insurance can be very expensive. Put options also expire, requiring the repurchase of more puts with longer life to keep a portfolio hedged.
Selling stock index futures against your portfolio merely locks in a price. Losses in the underlying portfolio may be offset by gains in the futures, but gains in the underlying portfolio can also be offset by losses in the short futures hedge.
Given the growing partisan divide – including the probability that Washington will continue to govern “crisis to crisis” – and assuming that one must maintain a large exposure to stocks to have any hope of generating a meaningful return in this zero interest rate environment, finding a workable hedge that isn’t too expensive and that doesn’t prevent stocks in one’s portfolio from generating a return in good times is even more important.
VIX Futures: A Pure Play on Fear
We believe we have found a hedging vehicle that gives us the best of both worlds: protection when we need it and the ability to participate in a continuation of the bull market. That vehicle is the VIX futures traded on the CBOE.
VIX is the symbol for the Chicago Board Option Exchange (CBOE) Volatility Index. It measures the fear imbedded into options traded on the S&P 500 (SPX) reflecting investors’ 30-day consensus view of the future. S&P 500 puts grant the buyer the right but not the obligation to sell the S&P 500 Index at a fixed price for a limited amount of time.
The more fearful investors are, the more they are willing to pay for put option protection. The more they pay, the higher the market volatility implied in the cost of S&P 500 options. This is what VIX measures.
Since fear is the strongest human emotion, it makes sense that VIX would rise and fall in proportion to fear. VIX tends to increase when investors expect big market declines and tends to decrease as fear of those declines subsides. This relationship can be seen clearly in the “Monthly VIX” chart below.
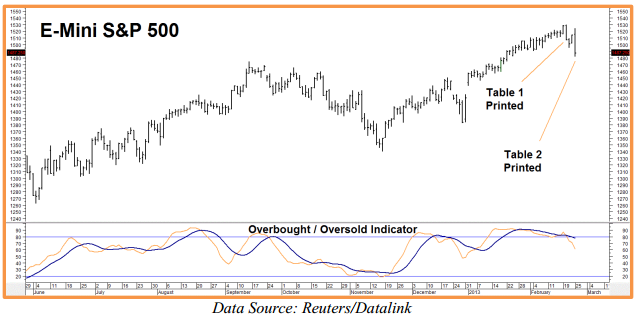
During the Lehman crisis, volatility as measured by VIX skyrocketed from just under 15% to 89% in 5 months. This coincided with a 58% decline in the S&P 500. (See “E-Mini S&P 500 Futures” chart below.) VIX soared from roughly the same level to over 45% during the stock market’s 17.6% decline in 2010 and made virtually the same move when stocks pulled back 22.3% in 2011.
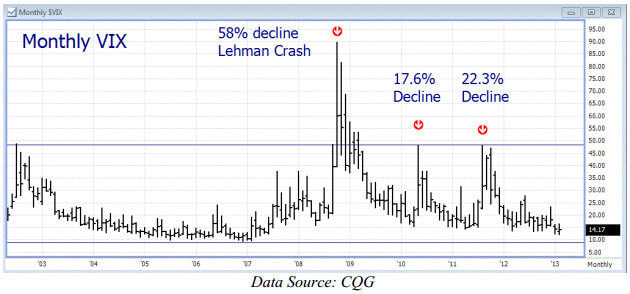
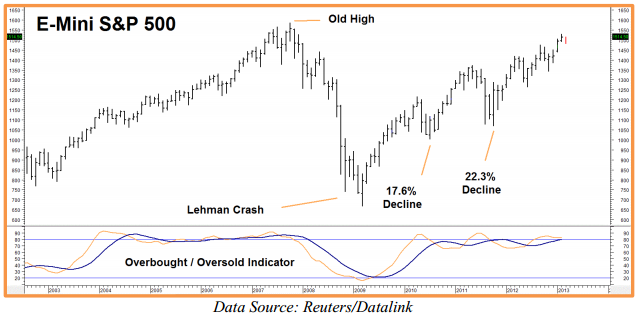
Notice how VIX tends to fluctuate in a well-defined range, from a low of roughly 9% to a high of approximately 45% — ignoring the incredible spike in volatility following the Lehman crash. Since VIX tends to move opposite stock prices, buying VIX when values are at the low end of this range should provide a good hedging strategy. A quick review of these two charts shows it does.
Notice how VIX rises when the stock market falls and falls when the market rises. Part of what makes VIX a good hedge is its tendency to fall more slowly during the good times. The fact that VIX measures fear and not a specific price level is also key to its versatility as a hedge.
One can hold long VIX futures – especially contracts purchased at the lower end of VIX’s historical range – and have them be just as effective as a hedge from higher stock market levels. Look at the two most recent corrections in 2010 and 2011; VIX spiked above 45.00% each time even though the 2011 correction began at a higher level.
VIX Futures: The Basics
The underlying value of VIX futures is $1,000 times the Index. That would make VIX futures at a price of 15.00% worth $15,000 and VIX futures at a price of 45.00% worth $45,000. VIX is purely an electronic contract. Normal trading hours are 8:30 am to 3:15 pm Chicago time. Extended trading hours begin at 7:30 am Chicago time. Liquidity, especially in the first two contract months, is very good and so is open interest.
Since volatility cannot drop below zero, buying VIX at 17.00 or lower implies a maximum risk of $17,000 plus transaction cost. Since VIX rarely drops below 9%, a hedging strategy based on buying VIX has a much lower practical risk. If we had purchased VIX futures at the low end of its trading range hedge prior to the 2010 or 2011 corrections, we would have been pretty well-protected.
Using VIX as a Hedge
Let’s assume that we purchased one VIX futures contract for each $100,000 of stock exposure in our portfolio and paid an average of 17.00% ($17,000) for each contract. When the VIX subsequently spiked to 47.00% ($47,000) in both years, gains in each futures contract would have offset roughly $30,000 worth of losses (or roughly 30%). Similarly, buying one VIX futures contract for each $200,000 in our portfolio would have offset a loss of roughly 15% in the underlying portfolio.
While there is no guarantee this level of protection will manifest itself in future declines, the charts on page 3 clearly show a pronounced tendency of VIX to increase sharply during major stock market corrections. Margin to trade one futures contract is currently $5,000. Buying VIX futures below 17.00 and posting $9,000 to cover declines below 8% for each $100,000 to $200,000 in portfolio value looks to be a solid, viable strategy. To make this strategy work properly, you must be committed to your hedge – willing to endure shorter-term losses and roll your position forward as the market dictates.
Buying Protection in a Bull Market
The table below shows a listing of VIX futures contracts reprinted from the CQG data feed from February 22, 2013 near the top of the early 2013 trading range in the S&P 500. Notice how the price rises the more time the contract covers. That’s because the VIX cash index is based on volatility derived from 30-day option premium. During a bull run, futures contracts with longer duration attempt to replicate the time premium of longer dated options. More time means more chances for something to go wrong. In this case, September 2013 VIX futures cost nearly 4.00 percentage points ($4,000) more than March futures.
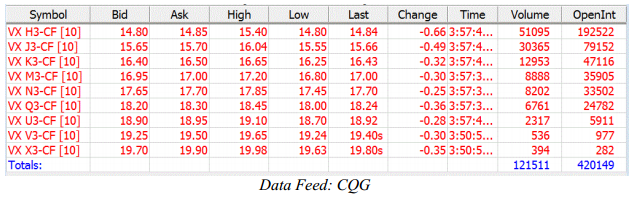
To avoid paying a premium for protection in bull markets, we attempt to buy shorter-term contracts and roll them as they approach expiration. Using the example above, we would buy the April VIX futures (note the good liquidity) and roll them into June VIX futures as the April contract approaches expiration by selling our April contracts and replacing them with June contracts.
Buying Protection at Market Turns
The whole structure of VIX contract months changes once bull market momentum is lost. The table above was reprinted when the S&P 500 was trading at roughly 1520 and looked like it would regain new highs. The table below was reprinted just 2 days later after the S&P 500 dropped sharply:
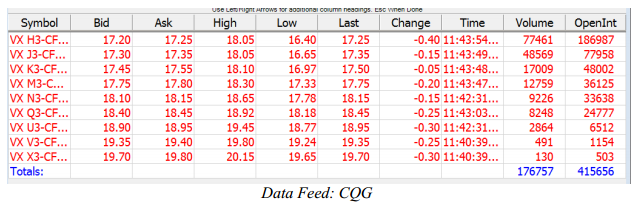
Notice how the premium between the March and the September futures declined from a full 4.00 percentage points to just 1.70 percentage points. The logic is the same. But instead of pricing in more time for something to go wrong, the September futures are now pricing in the probability something may get better. In this case it would make more sense to place your hedge further out – perhaps June or July – because you are not giving much up in terms of additional risk.
In either case, you don’t want to stray too far from the front contract. Why? Because the front contract is more volatile and will respond more quickly to changes in the underlying index and isn’t that what we want from a hedge?
When Should One Hedge?
The answer is dictated by your own risk tolerance. With the gridlock in Washington not easing any time soon and the classic “Sell in May and go away” timeframe soon upon us, we would consider establishing a position on a decline below 17.00% in the nearby VIX futures contracts – the closer to the bottom end of the historical VIX trading range, the better. Consider 1 futures contract for each $100K to $200K in underlying stock market value depending on your risk tolerance. Be prepared to back each contract with a margin deposit of at least $9,000.
Getting Started
You cannot trade VIX futures in your stock account. You need a separate commodity account. The RMB Group has been helping their customers trade futures and options since 1984 and are intimately familiar with the strategy in this report. Call us tollfree at 800-345-7026 or 312-373-4970 direct. We’ll send you everything you need to get started. Or visit us at contact us to open an account online and see other “big move” trade suggestions.
If you are new to futures and options and would like to know more, give us a call at the phone numbers above or e-mail suerutsen@rmbgroup.com and we will send you the RMB Short Course in Futures and Options (a $14.99 value) absolutely free. You can also download the “Short Course” from our education tools page.
This material has been prepared by a sales or trading employee or agent of R.J. O’Brien and is, or is in the nature of, a solicitation. This material is not a research report prepared by R.J. O’Brien’s Research Department. By accepting this communication, you agree that you are an experienced user of the futures markets, capable of making independent trading decisions, and agree that you are not, and will not, rely solely on this communication in making trading decisions.
DISTRIBUTION IN SOME JURISDICTIONS MAY BE PROHIBITED OR RESTRICTED BY LAW. PERSONS IN POSSESSION OF THIS COMMUNICATION INDIRECTLY SHOULD INFORM THEMSELVES ABOUT AND OBSERVE ANY SUCH PROHIBITION OR RESTRICTIONS. TO THE EXTENT THAT YOU HAVE RECEIVED THIS COMMUNICATION INDIRECTLY AND SOLICITATIONS ARE PROHIBITED IN YOUR JURISDICTION WITHOUT REGISTRATION, THE MARKET COMMENTARY IN THIS COMMUNICATION SHOULD NOT BE CONSIDERED A SOLICITATION.
The risk of loss in trading futures and/or options is substantial and each investor and/or trader must consider whether this is a suitable investment. Past performance, whether actual or indicated by simulated historical tests of strategies, is not indicative of future results. Trading advice is based on information taken from trades and statistical services and other sources that R.J. O’Brien believes are reliable. We do not guarantee that such information is accurate or complete and it should not be relied upon as such. Trading advice reflects our good faith judgment at a specific time and is subject to change without notice. There is no guarantee that the advice we give will result in profitable trades.