Welcome to Crypto World! Crypto World is a universe defined and dominated by the Internet, the cloud and millions of computer algorithms. Find your place in a cyber space where pieces of code can be more rare and valuable than gold. It is where a decade of artificially-low interest rates will force you to chase growth no matter the cost. Don’t worry, you’ll smile while doing it! In Crypto World nothing is cheap and charts like this rule.
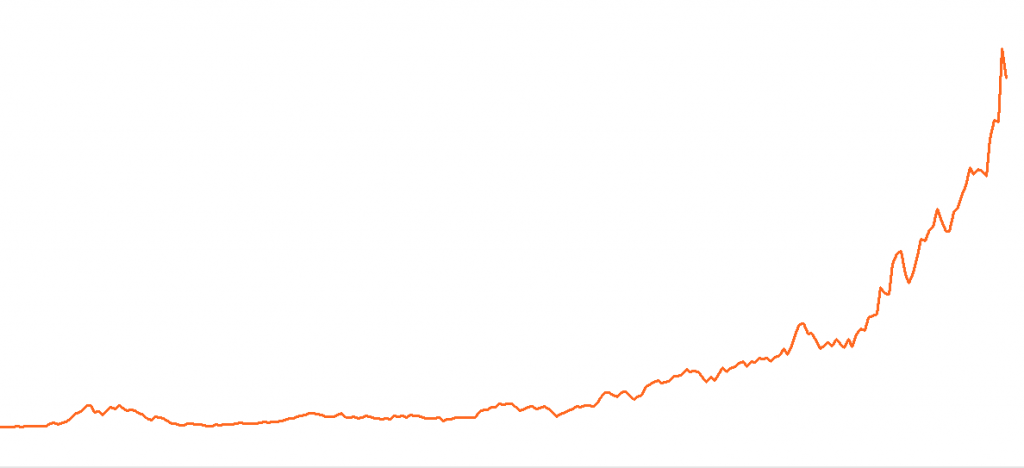
Data Source: Reuters/Datastream
Can you tell what this chart is? Bitcoin…Ethereum…Litcoin…Ripple? It could be anything, but let’s ask Alexa just to be sure. “Alexa, what is this?” If Alexa could “see” – which she probably will sooner than we can think – she’d identify the chart above as Amazon.com.
Many in the traditional financial establishment have labeled crypto-currencies as “tulip manias” which like the famous crash in the 17th century, are bound to end badly. Crypto-currencies may ultimately prove to be manias, but from a price action perspective they are not that much different than the Amazon.com chart above or other companies that populate Crypto World.
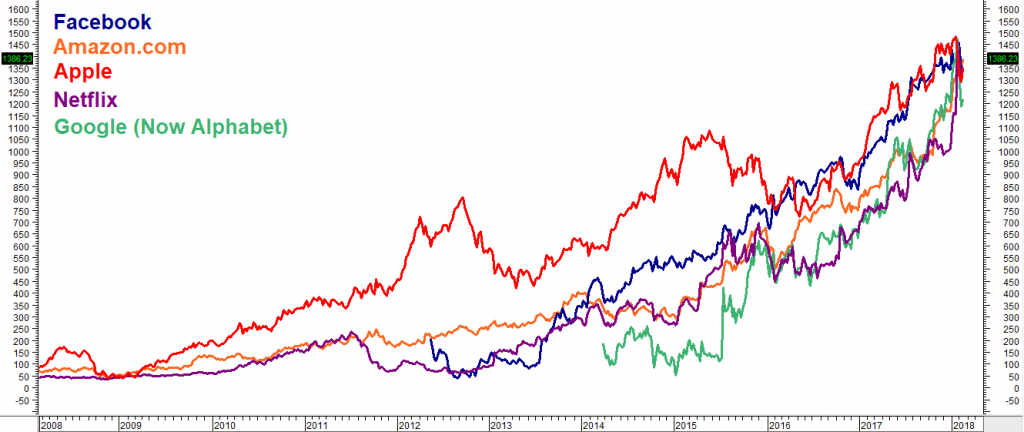
Are Amazon.com and the rest of its FAANG (Facebook, Apple, Amazon, Netflix & Google, now Alphabet) now “tulip bulbs” waiting to crash? Nobody knows. But what the Amazon.com chart does illustrate is an asset that is expensive, has been expensive for a very long time and continues to become even more expensive without any meaningful correction. Compare the charts of the FAANG stocks with that of Bitcoin (below).
Data Source: Reuters/Datastream
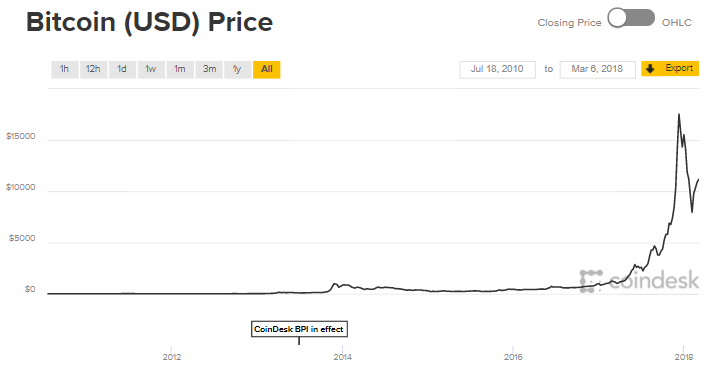
Based on price action alone, which asset class is more expensive? Is it the one that has corrected a little over 50% from high to low or the one that has yet to correct in any meaningful way? Hmmm… Since the information technology sector was responsible for 80% of the S&P 500’s 2017 gain, the answer to this question could be very important.
Some may argue this isn’t a fair comparison; comparing stocks to a crypto-currency is like comparing apples to tulips. They’ll point out that FAANG is comprised of actual companies while Bitcoin is just code in the ether. But was if Bitcoin is more than just a flash in the pan? What if it is a leading indicator for the entire information technology sector? Only time will tell.
Fair or not, one thing is for sure: all these huge success stories would not be possible without code. The same factors responsible for the rise of Bitcoin are also responsible for the rise of FAANG. Overregulation by governments or Internet failure due to either a massive power outage or a sophisticated hack could cause the collapse of both.
Neither Bitcoin nor FAANG would be possible without the following:
- The explosion of the Internet – it levels the playing field by providing instant and free access to information once only available to professionals, or at a cost. It is a powerful disrupter which can change a market or business model in the blink of an eye.
- Massive increases in computing power – they enable Artificial Intelligence (AI) to take over more and more tasks from human beings. Blockchain technology would be impossible without it.
- Virtually unlimited storage in the cloud – this provides huge datasets that can be mined for previously unknowable behavior patterns. If you “like” more than 120 things on Facebook and complete just a few of the many quizzes that clog your timeline, Facebook will literally “know” you better than your own mother. Blockchain couldn’t exist without cloud storage.
- Algorithms – computing power and storage mean algorithms are self-learning and can adjust to different patterns on the fly – changing entry and exit signals faster than it takes you to read this. Algorithms tend to pile on to what is already working, driving up asset prices much faster than old-style pit trading. They all tend to exit at the same time which causes big, unexpected collapses.
- Artificially low interest rates – they have forced investors further and further out on the risk curve and incentivized them to chase already sky-high asset prices.
Mere humans have little chance against the speed or efficiency of exponentially faster computing power. As a result, many investors have turned their portfolios over to the machines. While this works fine in a bull market, it can be a disaster when algorithms, all responding to similar exit signals, try to get out of an asset class at the same time.
The Key to Alpha Is Price
Bitcoin was an incredible alpha generator in 2017 – gaining 1,310 percent – because it began the year priced cheap at roughly $1,000 before topping out just short of $20,000 per bitcoin. Its price has already been cut in half as we write this. While Bitcoin may be a great alpha generator again, we believe it is a mistake to search for it there now.
The key to finding “alpha” is to find an asset class that is undervalued, get long and then wait. While finding value is even harder now, we believe we have found two markets cheap enough to outperform over the next 9 to 20 months. Silver and corn have been unloved and under-owned for a long-time. We don’t see this lasting much longer.
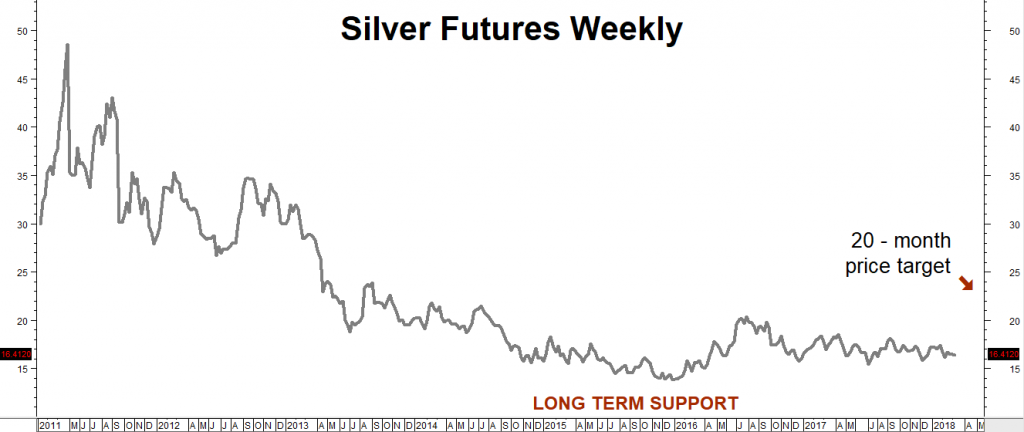
Data Source: Reuters/Datastream
One of the most volatile markets on the board – the “poor man’s gold” – has gone to sleep for the past 3 years. A big decline in volatility has driven down the price of silver call options traded on the COMEX and provided us with a rare opportunity. Our first price target is $23 per ounce which is roughly 32% above current levels.
Data Source: FutureSource
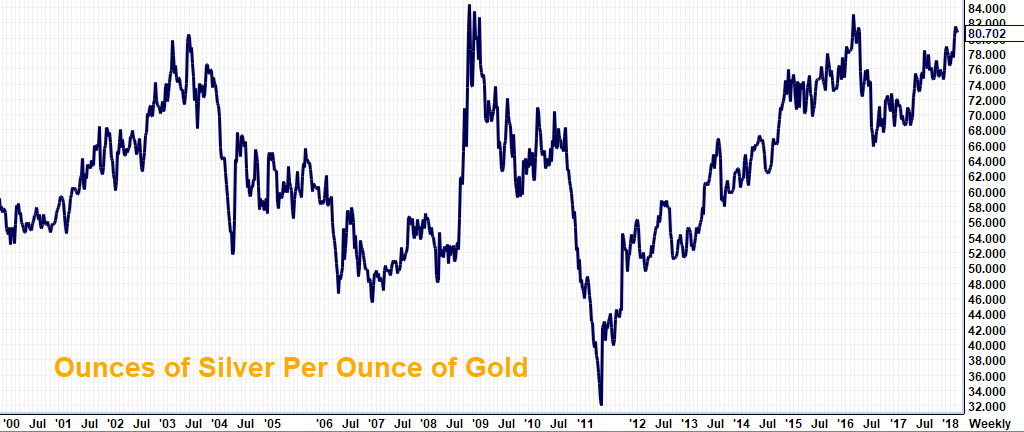
The chart above shows how many ounces of silver it takes to buy one ounce of gold. Gold is roughly 15 times rarer than silver. Back when both were considered currency, a ratio of roughly 16 to 1 predominated. Today’s ratio of 81 to 1 means silver is extremely cheap versus gold.
(Editors’ Note: Check out this silver article in from the Wall Street Journal, making many of the same points we make, but from the other side. When sentiment gets this bearish, we get interested. You may need a subscription to view this article.)
Silver tends to rally faster than gold in bull markets and to fall faster than gold in bear markets. Not surprisingly, this gold / silver ratio got as low as 32 ounces of silver to 1 ounce of gold at the peak of the 2011 precious metals bull market. Resistance today at 81 to 1 means a bounce may be in the offing.
5 Reasons We Like Long-Dated Silver Calls
- Like gold, silver competes with Bitcoin as a store of value. It should do well should the push to regulate crypto-currencies gain momentum and cause prices of crypto-currencies to fall.
- Inflationary forces are taking hold. Expansive global fiscal policies, deficit spending and a weaker dollar tend to be positive for precious metals.
- Options provide more potential “bang for the buck” than holding physical gold or silver outright.
- Low volatility means relatively cheap options. This is an anomaly. Silver options are usually much more expensive.
- Silver is extremely cheap in relation to gold.
What to Do Now
Consider buying long-dated COMEX silver December 2019 $20.50 calls while simultaneously selling an equal number of December 2019 COMEX silver $23.00 calls for a combined cost of 36 cents ($1,800) or less. Look for December 2019 futures to rally to $23 or above prior to option expiration on November 25, 2019. This gives us a little over 20 months to be right.
The maximum risk on this trade is $1,800 plus transaction costs. It has the potential to be worth as much as $12,500. Not sure how it works? Contact RMB Group toll free at 800-345-7026 or 312-373-4970 direct. Or email suerutsen@rmbgroup.com.
Corn Options Are Cheap
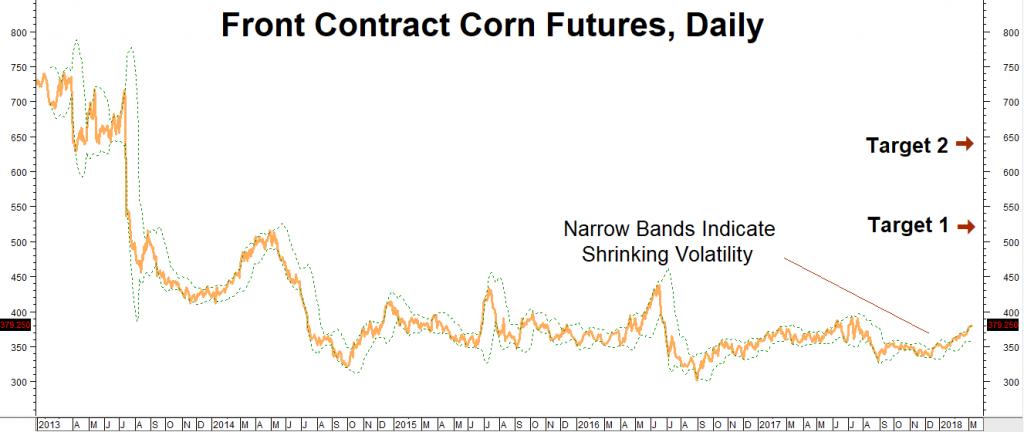
In Crypto World, agricultural commodities may be the only cheap assets left. One of the cheapest agricultural commodities is corn. Five years of bumper crops have kept up with growing demand – but just barely. Higher standards of living in population-heavy Asia have consumers eating more meat which requires significantly higher amounts of corn. With big crops just barely keeping pace with demand, any shortage due to disruptions caused by the current La Niña or any unforeseen weather event could have an outsized effect on price.
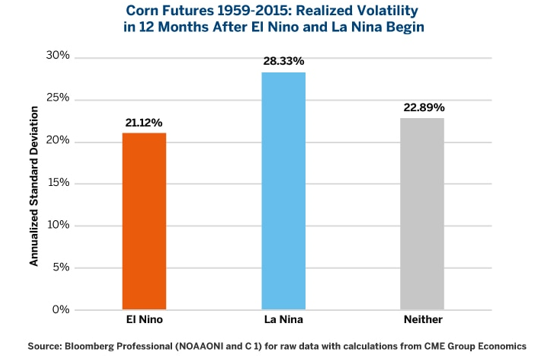 Corn option sellers usually demand a hefty premium to cover the potential for adverse weather – but not this year. Corn traders typically build in a volatility of 28% during a La Niña year. This year they’ve built in 13%, making corn options very inexpensive.
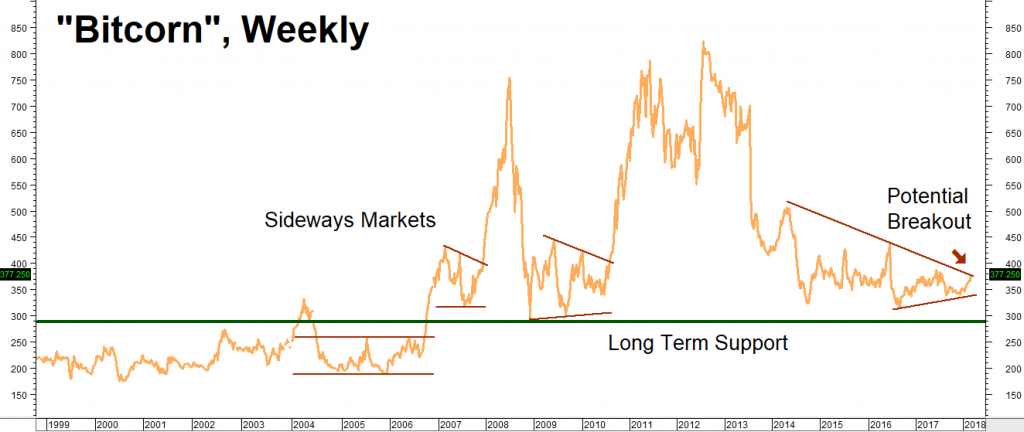
Corn is a grain so essential to life, it is often called “protein gold.” We believe the prospects of this market are so great, we call it “Bitcorn.”
5 Reasons We Like Long-Dated Corn Calls
- Agricultural commodities are one of the only cheap assets left.
- Demand keeps rising due to global population growth and changing diets.
- Five years of bumper crops are threatened by La Niña.
- Like gold, this “protein gold” benefits from a weaker dollar.
- Corn pricing has an abnormally low volatility of only 13%.
RMB Group has been banging the drum for long-dated corn calls since October and our patience appears to be paying off. As the chart below illustrates, corn has a history of making big runs after extended periods of sideways action. It looks like it may be in the early stages of a breakout now.
What to Do Now
Consider buying close-to-the-money December 2018 CBOT corn calls for $1,100 each or less, looking for “protein gold” to rally to $5.20 per bushel (a gain of 28.4%) from current levels – as high as $6.40 (a gain of 58%) – prior to option expiration on November 23, 2018. Your maximum risk is $1,100 plus transaction cost. Your $4.20 calls would be worth $5,000 at our $5.20 objective and $11,000 at our $6.40 objective.
Data Source: FutureSource
Data Source: FutureSource
Contact RMB Group toll free at 800-345-7026 or 312-373-4970 direct. Or email suerutsen@rmbgroup.com
Please be advised that you need a futures account to trade the recommendations in this report. The RMB Group has been helping its clientele trade futures and options since 1984 and are very familiar with all kinds of option strategies. Call us or go to www.rmbgroup.com for more information.
* * * * * * * *
The RMB Group
222 South Riverside Plaza, Suite 1200, Chicago, IL 60606
This material has been prepared by a sales or trading employee or agent of R.J. O’Brien and is, or is in the nature of, a solicitation. This material is not a research report prepared by R.J. O’Brien’s Research Department. By accepting this communication, you agree that you are an experienced user of the futures markets, capable of making independent trading decisions, and agree that you are not, and will not, rely solely on this communication in making trading decisions.
DISTRIBUTION IN SOME JURISDICTIONS MAY BE PROHIBITED OR RESTRICTED BY LAW. PERSONS IN POSSESSION OF THIS COMMUNICATION INDIRECTLY SHOULD INFORM THEMSELVES ABOUT AND OBSERVE ANY SUCH PROHIBITION OR RESTRICTIONS. TO THE EXTENT THAT YOU HAVE RECEIVED THIS COMMUNICATION INDIRECTLY AND SOLICITATIONS ARE PROHIBITED IN YOUR JURISDICTION WITHOUT REGISTRATION, THE MARKET COMMENTARY IN THIS COMMUNICATION SHOULD NOT BE CONSIDERED A SOLICITATION.
The risk of loss in trading futures and/or options is substantial and each investor and/or trader must consider whether this is a suitable investment. Past performance, whether actual or indicated by simulated historical tests of strategies, is not indicative of future results. Trading advice is based on information taken from trades and statistical services and other sources that R.J. O’Brien believes are reliable. We do not guarantee that such information is accurate or complete and it should not be relied upon as such. Trading advice reflects our good faith judgment at a specific time and is subject to change without notice. There is no guarantee that the advice we give will result in profitable trades.
This report was written by Investors Publishing Services, Inc. (IPS). © Copyright 2018 Investors Publishing Services, Inc. All rights reserved. The opinions contained herein do not necessarily reflect the views of any individual or other organization. Material was gathered from sources believed to be reliable; however no guarantee to its accuracy is made. The editors of this report, separate and apart from their work with IPS, are registered commodity account executives with R.J. O’Brien. R.J. O’Brien neither endorses nor assumes any responsibility for the trading advice contained therein. Privacy policy is available on request.