Futures Outlook: 10/15/13
Seeing Gold in Corn
This time of year when you think of corn you may have images of a fall table or Indian corn accents. Today, I want you to think of the grain itself. We may have very well found a nice support level from which to rally.
Corn
Corn has been failing for a while now, but we may finally be seeing the light and the opportunity to participate in a retracement at the very least.
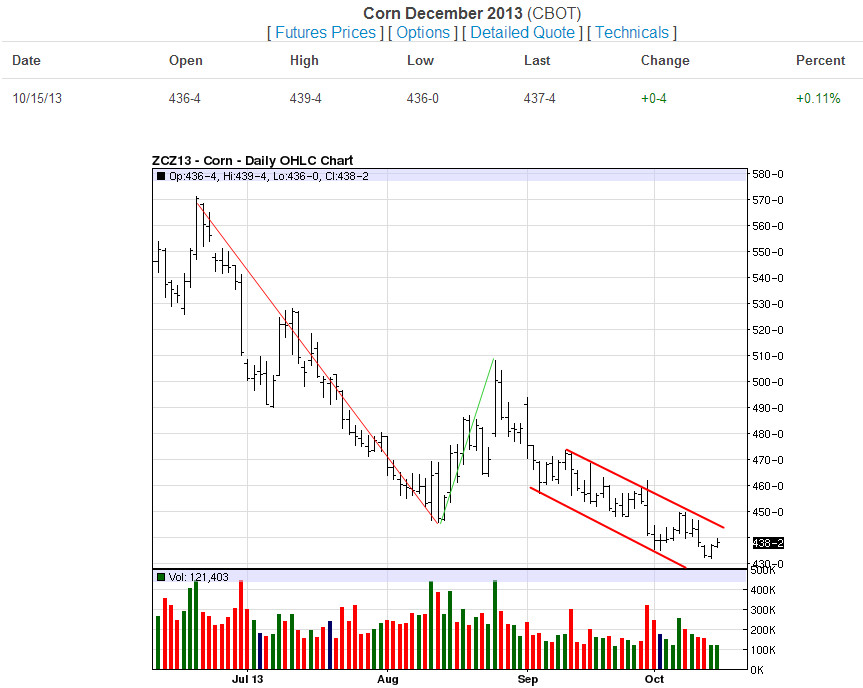
Per the image available on the Daily chart, you can see that we had a nice failure from June through mid-August. The retracement of that move peaked around 510 and has been continuing the downward trend since the latter part of August. What I want you to pay attention to now is that the continued failure that we’ve seen since the latter part of August has not been as steep as what we saw in the summer months. We have not moved lower with nearly the strength seen prior and right now it seems that we may be stalling a bit. I have highlighted a bit of a descending channel of sorts that illustrates the latest downward cycle. I want you to pay attention to the fact that we may be tightening up that range a bit and could be getting ready for a breakout to the high side. In the near term I would like to see 446 broken and for us to rest above that using it as a support level once broken. Just because that number is a bit of distance away doesn’t mean that you can’t be involved before the break. Think about using options to employ a fixed risk and lessen your capital exposure.
As we move forward to our Weekly chart:
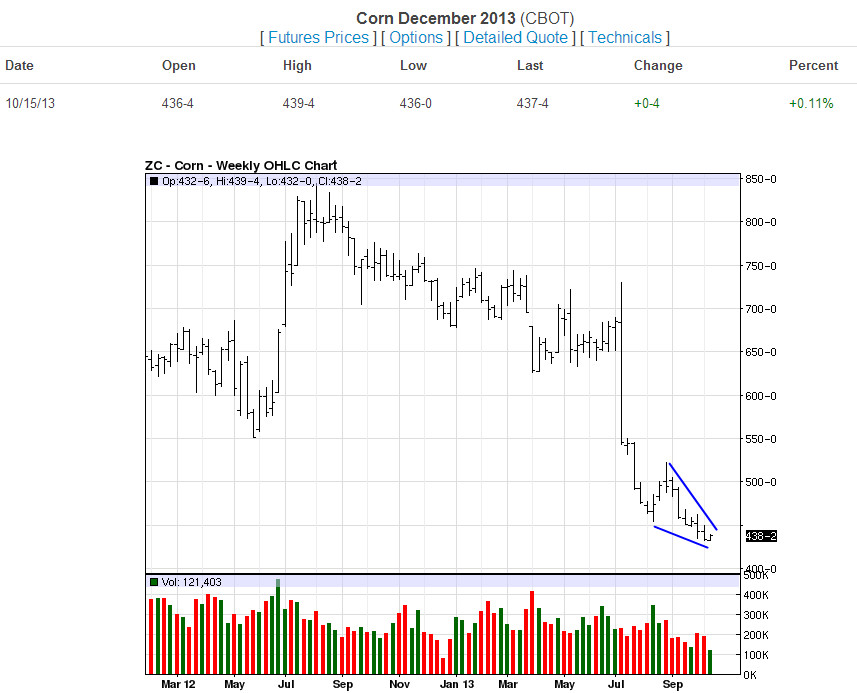
I have highlighted a wedge pattern here that adds to the need for a break on Corn on an intermediate basis. The combination of a slowing decline on the Daily chart and a wedge pattern here on the Weekly chart makes me excited about its potential to rebound higher.
Moving to the Monthly chart:
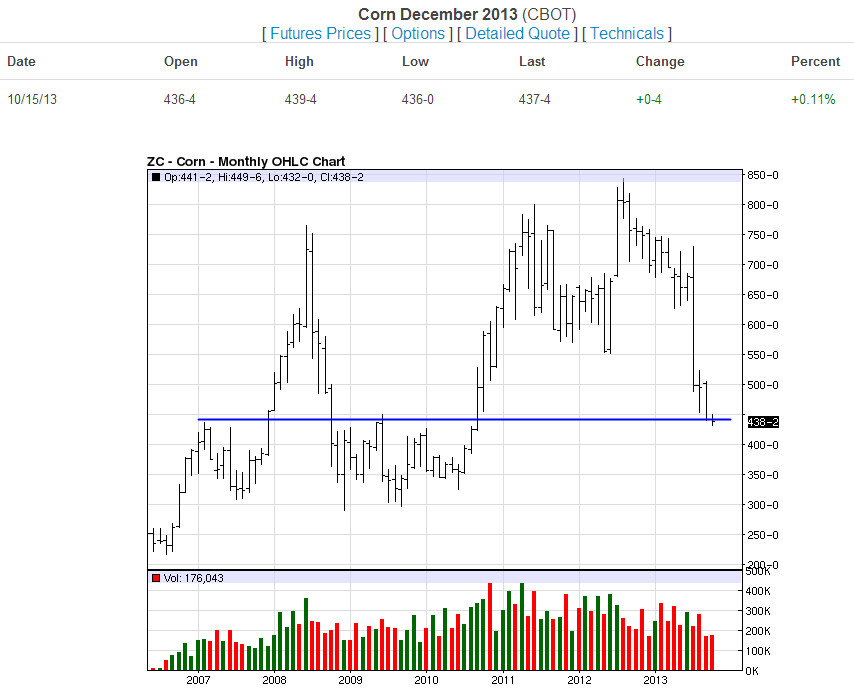
Here you can see the failure that was pretty extreme for Corn over the summer months and in addition you can see a bit more of the history going back to 2007. I have highlighted in blue an area that was previously resistance for Corn on the way up and the fact that we now might use it as support is a great addition for the strength that may ensue on a rebound. The territory between 430 and 450 is an area that could be used as immediate major support and that could help the Daily chart break out which could in turn cause the wedge to break from a Weekly perspective and just might allow a turn upward on the Monthly chart.
I love the opportunity for Corn to make up some of the ground that it has lost and I like the combination of the patterns on our near term charts and the potential support territory coming from the Monthly chart. As this move would be counter trend, we do have to keep that in mind and try to mitigate a bit of that inherent risk. Using Options is a great way to be involved in the pure play, utilize a fixed risk scenario, and lessen capital outlay in this market. Allow us to help you design the strategy that suits you best.
Remember, that we are here to keep your options clear.
Questions about this report or trading futures? Contact us online or at 1-800-345-7026. Follow us on Twitter @RMBGroupFutures