We’ve written at length about the importance of the 200-day moving average in the S&P 500, starting with our first blog post of the New Year. Buoyed by a Fed that swung from hawkish to dovish virtually overnight, and by rose-colored optimism on trade, an impressive rally in the S&P has put the 200-day moving average back in play – and erased nearly all it gave up in late 2018.
Nevertheless, we believe it is still too early to sound the “all clear” signal. Here are a few fundamental reasons why:
- Stocks have already priced in the return of the Fed Put. Expectations that the Fed will not only cease its tightening campaign, but reverse course and ease at the slightest hint of a recession may not turn out to be correct. Fed Chairman Powell is data-driven. Any uptick in inflation numbers – already unduly suppressed by low energy prices – will probably put one or two rounds of tightening back on the table. Crude oil is rallying. So is gold. Inflation is not dead.
- Stocks are in the late innings of the longest bull market in history. We are at or near the end of a bullish cycle. FOMO (fear of missing out) appears to be the driver of this rally. Valuations are stretched. These are not the components of a sustained move.
- FAANG has lost its bite. Apple and the rest of big tech led the most recent leg of the bull market. But big tech has lost its mojo. All of the FAANG stocks remain well off their highs. New leaders have yet to emerge.
Technical Lessons from 2008/2009 Crash
The chart below shows the entirety of the 2008/2009 crash. Reality changed once the E-Mini S&P 500 futures closed below the 200-day moving average. While the market did not head sharply lower immediately – and even managed new highs prior to the crash – one can see from the price action that the 200-day moving average remained important.
The market closed below the 200-day moving average in August 2008 for the first time in years and then proceeded to make new highs in October of the same year, fooling the bears. The next eight months were marked by multiple re-tests of the 200-day moving average in both directions before the market broke decisively below it in May 2009. The first penetration of the 200-day MA came nine months before the actual crash. In hindsight, it is easy to see that this was a signal that the economic realities which underpinned the previous bull market had changed – and that the prior bull market was on its last legs.
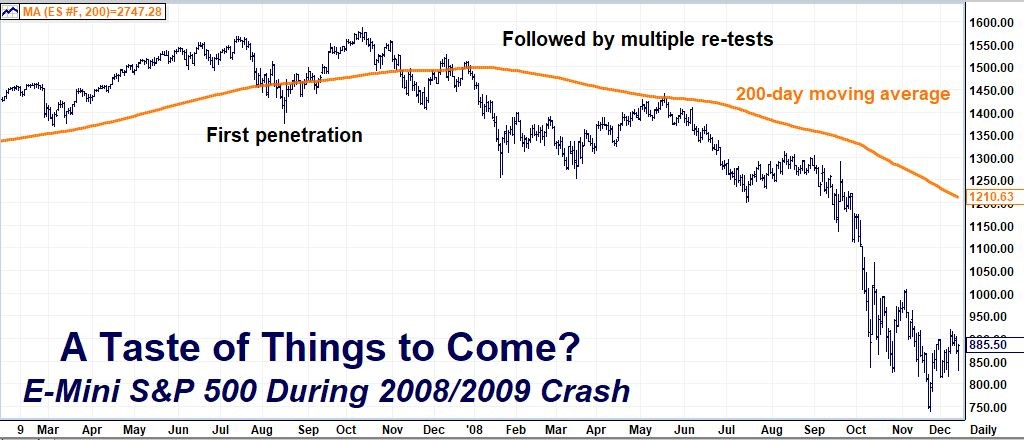
Data Source: FutureSource
Fast forward to today. The E-mini S&P 500 first closed below the 200-day moving average last April and proceeded to make new highs. These new highs have been followed by multiple closes below, as well as multiple re-tests, of the 200-day moving average. Each one has failed so far. History rarely repeats but it often rhymes, making the next week or so critical. The E-mini is extremely overbought after Friday’s rally and vulnerable to sharp reversals.
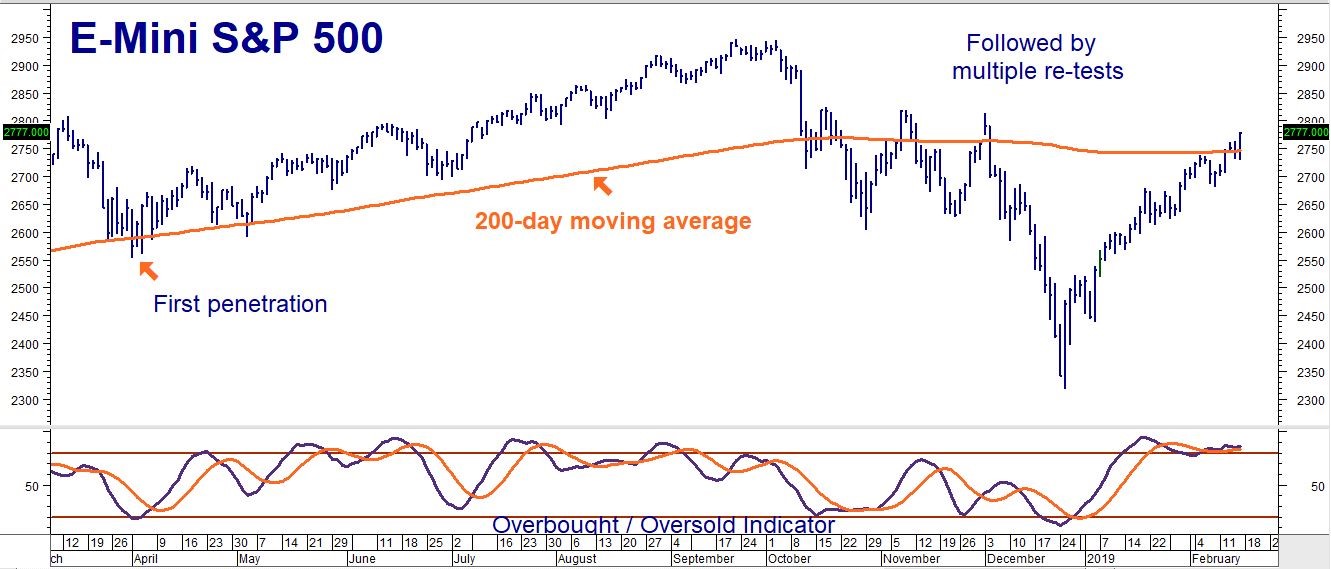
Data Source: Reuters
We should know shortly if Friday’s push back above the 200-day moving average is sustainable; we suspect it is not. We will let the market tell us tell us how to respond and will consider using a number of consecutive closes below Friday’s low of 2729 as a signal to establish new bearish positions. RMB trading customers heavy in stocks may want to consider this retest of the 200-day moving average as an opportunity to hedge using E-mini S&P 500 options.
Unfortunately, it looks like our recommendation to “Sell the Rip” in the E-mini S&P 500 was early. With only 26 days left until expiration, the odds that our March 2300 / 2400 bear put spreads in the E-mini S&P 500 will finish in the money are slim. The good news is, we did not risk a whole lot on this trade, and who knows? The market could take another big dive in that timeframe. This is why we use options.
Please be advised that you need a futures account to trade the markets in this post. The RMB Group has been helping its clientele trade futures and options since 1984 and are very familiar with all kinds of option strategies. Call us toll-free at 800-345-7026 or 312-373-4970 (direct) for more information and/or to open a trading account. Or visit our website at www.rmbgroup.com.
* * * * * * * *
The RMB Group
222 South Riverside Plaza, Suite 1200, Chicago, IL 60606
This material has been prepared by a sales or trading employee or agent of R.J. O’Brien & Associates (“RJO”)/RMB Group and is, or is in the nature of, a solicitation. This material is not a research report prepared by a Research Department. By accepting this communication, you agree that you are an experienced user of the futures markets, capable of making independent trading decisions, and agree that you are not, and will not, rely solely on this communication in making trading decisions.
DISTRIBUTION IN SOME JURISDICTIONS MAY BE PROHIBITED OR RESTRICTED BY LAW. PERSONS IN POSSESSION OF THIS COMMUNICATION INDIRECTLY SHOULD INFORM THEMSELVES ABOUT AND OBSERVE ANY SUCH PROHIBITION OR RESTRICTIONS. TO THE EXTENT THAT YOU HAVE RECEIVED THIS COMMUNICATION INDIRECTLY AND SOLICITATIONS ARE PROHIBITED IN YOUR JURISDICTION WITHOUT REGISTRATION, THE MARKET COMMENTARY IN THIS COMMUNICATION SHOULD NOT BE CONSIDERED A SOLICITATION.
The risk of loss in trading futures and/or options is substantial and each investor and/or trader must consider whether this is a suitable investment. Past performance, whether actual or indicated by simulated historical tests of strategies, is not indicative of future results. Trading advice is based on information taken from trades and statistical services and other sources that RJO/RMB believes are reliable. We do not guarantee that such information is accurate or complete and it should not be relied upon as such. Trading advice reflects our good faith judgment at a specific time and is subject to change without notice. There is no guarantee that the advice we give will result in profitable trades.