“The best cure for low prices is low prices.” This phrase, made popular in the trading pits at the Chicago Board of Trade, sums up our take on two markets we believe to be among the biggest bargains in the commodity sector right now. Perfect growing weather and huge yield estimates for the US corn crop as well as big Russian harvests of wheat have weighed heavily on both corn and wheat, driving the prices of both grains to multi-year lows that are either right on (in the case of corn) or just above (in the case of wheat) long term support levels.
While cheapness alone should never be a good enough reason to buy anything, corn and wheat are currently trading well below the cost of production, a situation we believe the market will begin sorting out in late 2016 and the first half of 2017.
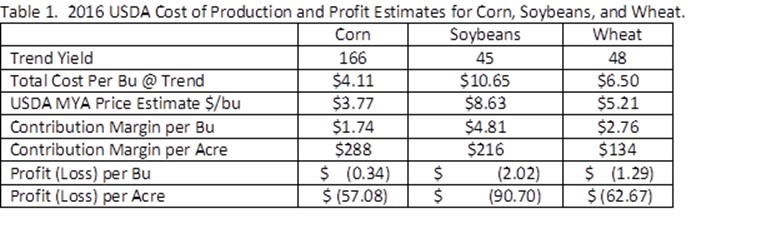
The table above shows 2016 USDA cost of production estimates for corn of $4.11 per bushel, $10.65/bu for soybeans and $.650/bu for wheat. It compares them with the USDA market price estimates for each. The futures markets point in a different direction. On August 17, 2015, December corn futures settled at just below $3.40 per bushel and December soft, red wheat futures finished at $4.43 per bushel. This is much lower than those estimated by the USDA.
Using the USDA’s $4.41 per bushel cost of production for corn and $6.50/bu cost for wheat, this pushes loss per bushel to 71 cents for corn and $1.97 per bushel in wheat. We believe prices of both grain are now to a point where producers will begin to lose their incentive to produce. However, this may not happen immediately.
Costs Can Temporarily Distort Producer Incentives
The USDA’s estimated cost of production includes a lot of indirect costs like land and depreciation of machinery. These ongoing expenses make up roughly 42% of the cost to produce corn and little over 50% of the cost to produce wheat. The graph below shows the breakdown per acre for the three major American crops.
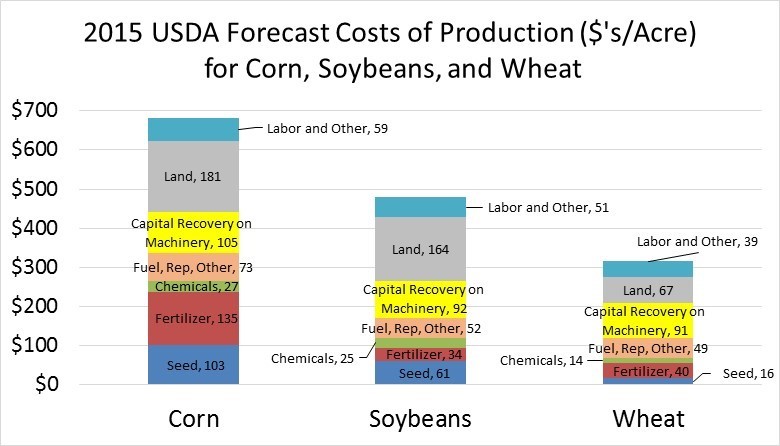
Farmers need cash to operate and can be forced to sell crops at a loss in order to meet immediate expenses like seed, fertilizer, fuel and labor. This can weigh on an already weak market, delaying recovery. Indirect costs like land depreciation accumulate over a longer time frame but they still need to be paid eventually. If prices remain this low heading into next year, farmers will announce their intentions to plant fewer acres and the market should react accordingly
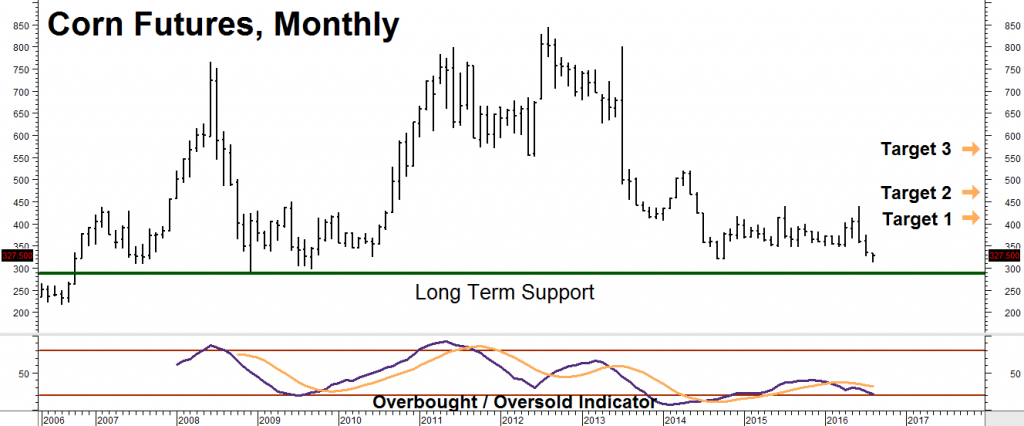
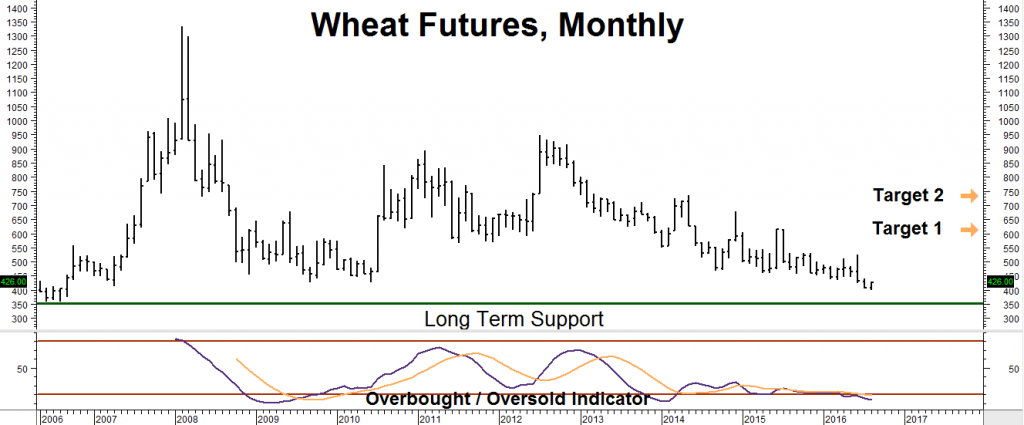
You can see the ebb and flow of price in the monthly price charts of both corn and wheat (below). Prices have oscillated in a wide trading range between $3.00 per bushel and $8.00 per bushel for the past 10 years. Low prices cause producers to plant fewer acres which causes prices to rise in subsequent years. High prices cause farmers to plant more acres and prices fall back down, beginning the cycle again. This is a phenomenon seen in most commodities; make something cheap enough and production drops; make it expensive enough and production will rise.
Data Source: Reuters / Datastream
Data Source: Reuters / Datastream
Grain Demand Not Going Away
Economics 101 tells us that the basic forces of supply and demand rule all markets. People have to eat and global population continues to expand. Add the growing preference of the world’s most populous nations in Asia for meat and the demand side of this equation for grains is already dialed in. It takes roughly 4 pounds of corn to make one pound of pork and roughly 8 pounds of corn to make one pound of beef. The Chinese affinity for former is well known. As the overall affluence of Asia grows, so should its consumption of meat and, by extension, corn.
Supply is where most of the heavy lifting occurs in the grain markets. What affects supply more than anything? Weather. Fantastic growing weather in North America is responsible for the latest swoon in the grains and is already baked into prices. Soon the focus will shift to the South American planting season and the weather outlook for the American breadbasket next year. Global climate change means it is even harder to get reliable long-term weather forecasts. We believe the one thing we can count on is an increase of more extreme events.
California is burning in the aftermath of a punishing, five-year drought while Louisiana is drowning in the face of a completely unexpected 1,000-year flood. The odds that there will be more of these extreme weather events grow in lockstep with every increase in global temperature. It is only a matter of time before they negatively impact food production.
Will La Niña Return?
One well-known weather phenomenon with the potential to negatively affect corn and wheat production – especially in North America – is La Niña. La Niña is cooling of Equatorial waters off the coastlines of South and Central America. Its effects are nearly the opposite of its big brother El Niño and include wetter-than-normal conditions across big swaths of South America and drier-than-normal conditions across grain producing regions of the United States.
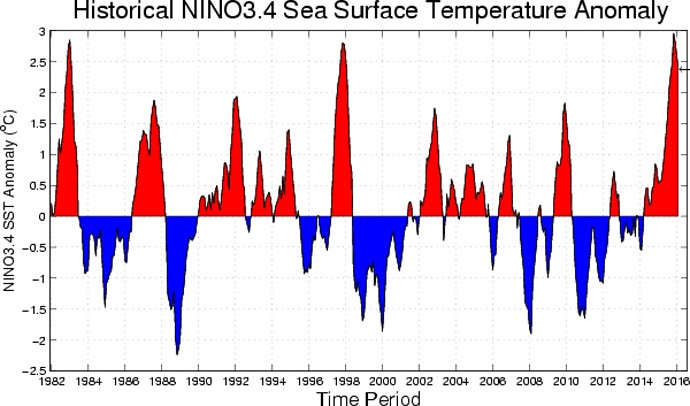
Source: NOAA
Strong El Niños tend to be immediately followed by strong La Niñas. This pattern is illustrated in the graph above with the red-shaded areas indicating El Niño events and the blue-shaded areas indicating La Niña events. The last two big rallies in corn that saw prices spike to $7.65 per bushel in 2008 and $8.06 per bushel in 2012 correlate nicely with the past two big La Niña events.
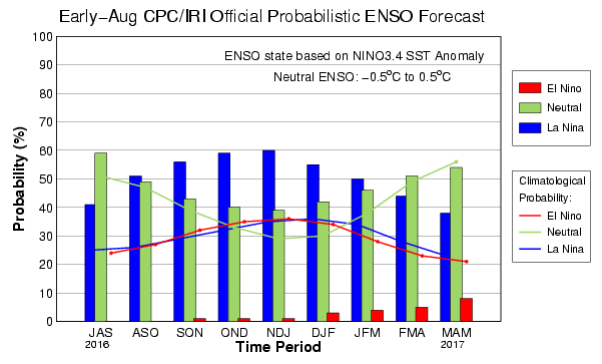
Will another big La Niña follow this year’s “Godzilla” El Niño? The climate scientists at NOAA are giving it a roughly 60% chance of forming between October and January of this year. (See graph below.) Things could get real interesting in grains should La Niña follow its past patterns and steal the spotlight from her brother this winter.
Source: NOAA
Corn Is A Buy
We believe that just about all the good supply news is already priced into the yellow grain. At $3.41 per bushel, corn is both historically cheap and 71 cents below the UDSA’s estimated cost of production. Add in the possibility of another bullish La Niña forming in the next few months and you get the makings of a long-term, potentially “big move” trade.
Wheat is also cheap and below the cost of production in the US, but supply of the wavy grain is far more global. We may have more on wheat in future “Alerts” but are focusing on corn now because it is exhibiting a favorable option profile which enables bulls to take a limited risk bullish position without sacrificing a whole lot of up upside.
Long dated options in corn are currently exhibiting what traders call bullish “volatility skew.” In simple English, this means call options are extremely expensive in relation to put options. This asymmetry is making it possible for customers to fix the risk in a long-term bullish position for virtually no cost. This condition is not present in wheat right now.
Using “Volatility Skew” To Our Advantage
December 2017 corn futures – representing next year’s crop – are currently going for $3.83 per bushel, which is still below this year’s $4.11 cost of production. December 2017 $3.20 puts are currently trading for 8 cents per bushel or $400 each. Buying these puts give the holder the right but not the obligation to short corn futures at $3.20 per bushel, which is 63 cents or 16.44% below the market.
December 2017 $5.20 calls are also trading for 8 cents or $400. But the strike price of this call is $1.37 or 35.78% above the market. A seller of this call collects $400 in exchange for the obligation to sell corn for $5.20 per bushel. Why does a call with a strike price 35.78% above the market trade for the same price as a put option only 16.44% below the market? Because option traders expect far more upside volatility. We can use this to our advantage to create a bullish position.
Our upside price targets in corn (see chart at the beginning of this “Alert”) are $4.20, $4.70 and $5.40. We don’t know when corn will bounce from current long-term support but want to be in the market when is does. Consequently, we are recommending our trading clients to consider buying December 2017 corn futures while simultaneously selling an equal number of December 2017 $5.20 calls and buying an equal number of December $3.20 puts.
At current prices, the money we receive from selling the calls completely pays for the puts, leaving us with a long-term trade with a maximum risk of 63 cents ($3,150) plus transaction costs, and a potential upside of $6,850. Volatility skew means the $5.20 calls we are selling are very expensive in relation to the $3.20 puts we are buying – enabling us to buy an insurance policy on our long futures positon for virtually nothing.
Prices can and do change, so check with your personal RMB Broker for the latest. He or she may also have bullish strategies that can enable you to trade the long side in both corn and wheat for even less risk. We will be watching forecasts involving La Niña closely. More aggressive forecasts for La Niña could lead to spark a rally soon. Check out NOAA’s website www.noaa.gov for the latest updates.
If You Are Not an RMB Group Trading Client…
Please be advised that you need a futures account to trade the recommendations in this report. The RMB Group has been helping their customers trade futures and options since 1984 and are very familiar with the strategies suggested in this report. Call us toll-free at 800-345-7026 or 312-373-4970 direct to learn more. We’ll send you everything you need to get started. You can also visit www.rmbgroup.com to open an account online.
If you are new to futures and options and want to learn more, download the RMB Short Course in Futures and Options. This easy-to-read guide covers all the basics. Call us toll-free at 800-345-7026 or 312-373-4970 direct for your free copy or go to our website at www.rmbgroup.com. Click the “Education Tools” tab at the top of the home page and scroll down to find the report.
—
The RMB Group
222 South Riverside Plaza, Suite 1200, Chicago, IL 60606
This material has been prepared by a sales or trading employee or agent of R.J. O’Brien and is, or is in the nature of, a solicitation. This material is not a research report prepared by R.J. O’Brien’s Research Department. By accepting this communication, you agree that you are an experienced user of the futures markets, capable of making independent trading decisions, and agree that you are not, and will not, rely solely on this communication in making trading decisions.
DISTRIBUTION IN SOME JURISDICTIONS MAY BE PROHIBITED OR RESTRICTED BY LAW. PERSONS IN POSSESSION OF THIS COMMUNICATION INDIRECTLY SHOULD INFORM THEMSELVES ABOUT AND OBSERVE ANY SUCH PROHIBITION OR RESTRICTIONS. TO THE EXTENT THAT YOU HAVE RECEIVED THIS COMMUNICATION INDIRECTLY AND SOLICITATIONS ARE PROHIBITED IN YOUR JURISDICTION WITHOUT REGISTRATION, THE MARKET COMMENTARY IN THIS COMMUNICATION SHOULD NOT BE CONSIDERED A SOLICITATION.
The risk of loss in trading futures and/or options is substantial and each investor and/or trader must consider whether this is a suitable investment. Past performance, whether actual or indicated by simulated historical tests of strategies, is not indicative of future results. Trading advice is based on information taken from trades and statistical services and other sources that R.J. O’Brien believes are reliable. We do not guarantee that such information is accurate or complete and it should not be relied upon as such. Trading advice reflects our good faith judgment at a specific time and is subject to change without notice. There is no guarantee that the advice we give will result in profitable trades.
This report was written by Investors Publishing Services, Inc. (IPS). © Copyright 2016 Investors Publishing Services, Inc. All rights reserved. The opinions contained herein do not necessarily reflect the views of any individual or other organization. Material was gathered from sources believed to be reliable; however no guarantee to its accuracy is made. The editors of this report, separate and apart from their work with IPS, are registered commodity account executives with R.J. O’Brien. R.J. O’Brien neither endorses nor assumes any responsibility for the trading advice contained therein. Privacy policy is available on request.