Commodities do not always move together. Gold and crude oil moved in virtual lockstep until 2011 when they began to diverge dramatically. Gold was the initial beneficiary, soaring while crude oil tanked. The opposite is happening now. Gold has collapsed nearly 33% since October while crude has soared nearly 26% since mid-April, providing us with the opportunity for what could be a very powerful “pair trade.”
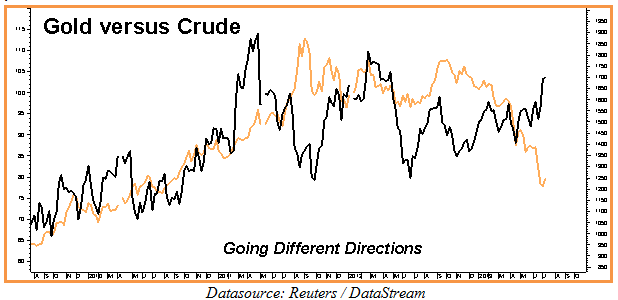
As the chart above suggests, big divergences in the prices of gold and crude oil tend not to last very long. Like electromagnets with oscillating polarities, gold and crude oil have been alternately attracting and repelling each other every three to four months, reversing directions in the process.
Will it happen again? Nothing is guaranteed. Gold and crude could keep heading in separate directions for awhile longer. However, the fact that they have diverged so much in such a short period of time leads us to believe we are within weeks and perhaps even days of a big move back the other way.
Both of these markets have been moving contrary to common wisdom which says that crude oil “should be” declining due to the slowing economy in China and North American shale oil and that gold “should be” rallying because of soaring Chinese demand and rampant central bank money printing. In the case of crude, the fear of a meltdown in the Mid-east involving Syria, Iran, Egypt or all three has easily trumped supply / demand fundamentals. In gold, the culprit is the soaring stock market. Investors see stocks as a better value and are choosing them over the shiny metal – at least for now.
Best and Worst Already Factored In
OE believes the worst and most bullish scenario (more instability in the Mid-east) is already built into crude oil prices and that the best and most bearish (an extended continuation of the already incredible rally in stocks) is already built into the gold market. Consequently, we believe this is a perfect time to sell crude oil and buy gold in with the anticipation that their prices will begin to converge shortly.
In order for this to happen either: 1) crude oil needs to decline faster than gold; 2) gold needs to rise faster than crude oil; or 3) crude needs to decline while gold simultaneously rallies. We believe the chances that one of these three scenarios will occur before the end of the year are good given how far this relationship has been.
Set It And Forget It
We would not recommend playing this spread using the futures contracts or ETFs because the prices of gold and crude oil could diverge a bit more. What we do recommend is using options to create a fixed-risk strategy designed to weather any near-term storms but with the potential to pay off if and when the gold / crude oil spread starts to narrow again.
The two part strategy recommended below is a “set it and forget it” play designed to capitalize on a moderate narrowing of the current differential. The trade below was entered with December 2013 gold trading at $1,286 per ounce and December 2013 crude oil trading at $101.00 per barrel.
Prices of the underlying markets can and will change. Have your broker work with you to create a similar strategy based on the relative prices of the underlying markets. This may involve using different strike prices.
Here are the guidelines: A) Use December 2013 crude oil and gold options. B) Receive at least $13 ($1,300) for the bull put spreads we recommend selling (shorting) in gold. C) Pay no more than $1.10 ($1,100) for the bear put spreads we recommend buying in crude.
Step 1– Sell Slightly In-The-Money December Bull Put Spreads In Gold
Consider placing an order to buy December 2013 $1,300 COMEX gold puts while simultaneously selling an equal number of December $1,325 gold puts for $13.00 ($1,300) or more looking for gold to be above $1,325 by the expiration of the December options on November 25, 2013.
If filled, the maximum risk on this leg of the trade is $12.00 ($1,200) plus transaction cost. We can make the $1,300 we receive for selling the spread.
Step 2 – Use the Money Received from “Step 1” to Buy Slightly Out-of-the-Money Bear Put Spreads In Crude Oil
“Putting” It Together
We actually receive some cash for putting on this trade. Subtracting the $1,100 we are paying for the bear put spread in crude oil from the $1,300 we receive from selling the bull put spread in gold gives us a net credit of $200. To find total risk we add up the $1,200 we have at risk in Step 1 to the $1,110 risk in Step 2 to get a maximum possible risk of $2,300 plus transaction cost. To figure maximum potential we add up the $1,300 we can make in Step 1 with the net $3,900 we can make in Step 2 to get $5,200.
Here’s how the trade shakes out in four potential scenarios at option expiration:
1.) Gold rallies while crude declines: If gold is over $1,325 per ounce and crude is under $90 per barrel we can make the entire $5,200 net potential.
2.) Both gold and crude oil rally: If gold is over $1,325 and crude is over $95, we will get to keep the $1,300 we receive for selling the bull put spread in gold and we lose the entire $1,100 we pay for the bear put spread in crude for a net gain of $200.
3.) Both gold and crude oil decline: If gold is under $1,300 we lose the $1,200 we have at risk on our short bear put spreads. If crude is under $90 we make $3,900. This gives us a net gain of $2,800.
4.) Gold continues to decline while crude oil rallies: we lose the $2,300 we have at risk but no more.
Note: You can also do either Step 1 or Step 2 on a standalone basis using the risk parameters outlined above. However doing so means taking a directional stance rather than playing the relationship between these two key commodities.